Unlock a world of possibilities! Login now and discover the exclusive benefits awaiting you.
- Qlik Community
- :
- All Forums
- :
- QlikView App Dev
- :
- A diagram of an expression has two kinds of displa...
- Subscribe to RSS Feed
- Mark Topic as New
- Mark Topic as Read
- Float this Topic for Current User
- Bookmark
- Subscribe
- Mute
- Printer Friendly Page
- Mark as New
- Bookmark
- Subscribe
- Mute
- Subscribe to RSS Feed
- Permalink
- Report Inappropriate Content
A diagram of an expression has two kinds of display methods for a linear, one kind of bar.
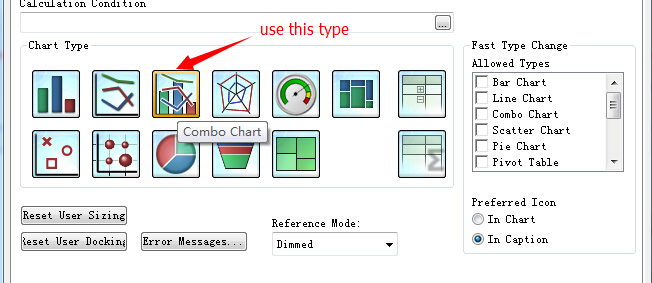
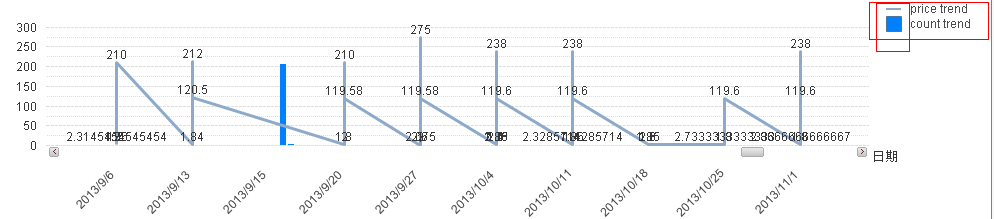
I have create a chart which use a combination chart,in the chart only one expression, I want to make some data using a bar chart, part of the data using theline graph.
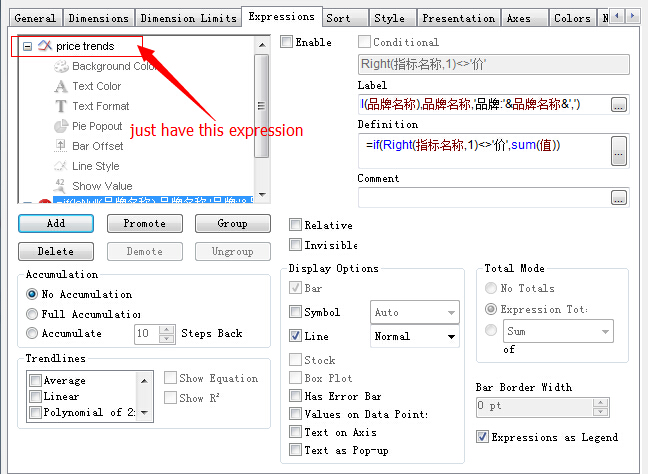
In this chart,there is an expression called "price trends", there is a selection field,the field contains the amount, price, volume, and I want to make price-related data using linear display, and the amount of data related to the amount of use the bar display.
In my qvw like this:
If chose “amount”and “price”,the data related to “amount” use bar display,and the data related to “price” use linear display.
Thank you very much.I need your help.
- Mark as New
- Bookmark
- Subscribe
- Mute
- Subscribe to RSS Feed
- Permalink
- Report Inappropriate Content
Hi ji,
I read your post twice, but I'm not sure I understand just what is it you're having trouble with: You have two expressions in your chart, one as a line and one as a bar (checkboxes "Display options"). That is not directly related to user_selections.
I would like to help if I can - but I need to understand what is not working.
Best regards,
DataNibbler
- Mark as New
- Bookmark
- Subscribe
- Mute
- Subscribe to RSS Feed
- Permalink
- Report Inappropriate Content
Hi DataNibbler,
Thank you for your reply.
There are two dimensions in my qvw,one is date,the other one is Combination of multiple fields.like this: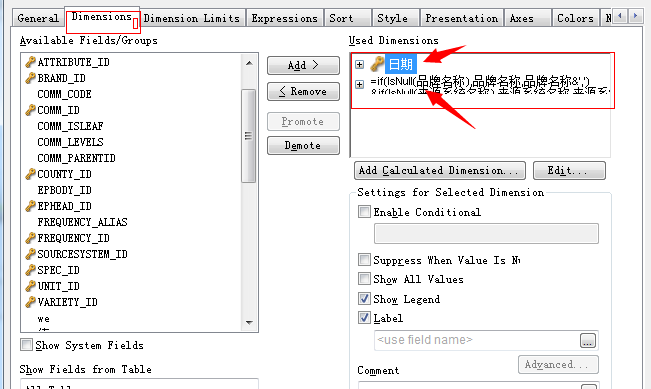
If I use one expresion,the result:
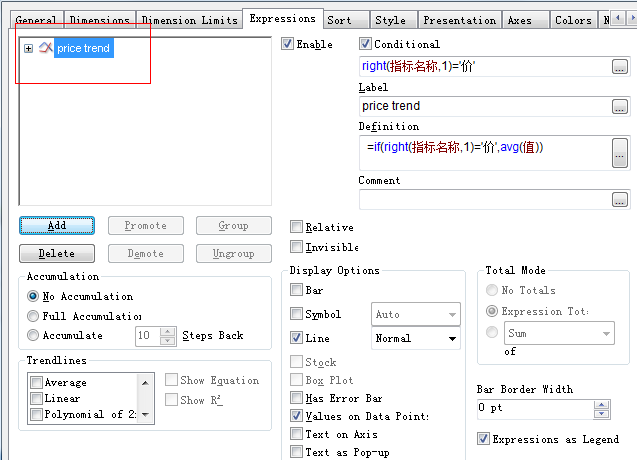
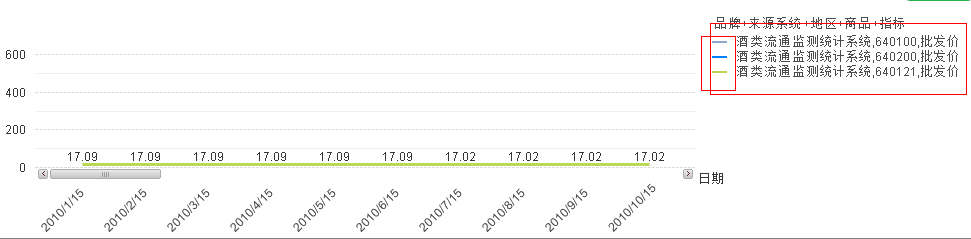
If I use two expression,the result:
In the way of one expression we can distinguish all data by color,but if I use two expression,we can not distinguish them by color.
Taking into account this problem,I want to use just one expression to show data in two kinds of charts!
I hope you can help me,Thank you very much.
- Mark as New
- Bookmark
- Subscribe
- Mute
- Subscribe to RSS Feed
- Permalink
- Report Inappropriate Content
Hi
I think you should simple your question and simple your example. There are a lot of informatin has nothing to do with your questoin.
Z
- Mark as New
- Bookmark
- Subscribe
- Mute
- Subscribe to RSS Feed
- Permalink
- Report Inappropriate Content
Just one expression displays two graphs,one is bar,the other is line.
- Mark as New
- Bookmark
- Subscribe
- Mute
- Subscribe to RSS Feed
- Permalink
- Report Inappropriate Content
cope the expression and select bar for one and line for the other
hope this helps
regards
Marco
- Mark as New
- Bookmark
- Subscribe
- Mute
- Subscribe to RSS Feed
- Permalink
- Report Inappropriate Content
Hi,Marco
Could you please tell me how to do in details?
Thank you very much.