Unlock a world of possibilities! Login now and discover the exclusive benefits awaiting you.
- Qlik Community
- :
- All Forums
- :
- QlikView App Dev
- :
- Re: Above with more than one dimension and missing...
- Subscribe to RSS Feed
- Mark Topic as New
- Mark Topic as Read
- Float this Topic for Current User
- Bookmark
- Subscribe
- Mute
- Printer Friendly Page
- Mark as New
- Bookmark
- Subscribe
- Mute
- Subscribe to RSS Feed
- Permalink
- Report Inappropriate Content
Above with more than one dimension and missing dimension value
Hi,
I am trying to calculate the quantity for a product for the same day (as today) last week in a table. The table looks like this:
Product | Weeknumber | Weekday | Quantity | Quantity (last week) | Diff | Diff (%) |
Product 1 | 11 | Monday | 4 146 | 0 | 4146 | 100,00% |
Product 1 | 11 | Tuesday | 4 506 | 0 | 4506 | 100,00% |
Product 1 | 11 | Wednesday | 4 626 | 0 | 4626 | 100,00% |
Product 1 | 11 | Thursday | 4 714 | 0 | 4714 | 100,00% |
Product 1 | 11 | Friday | 4 740 | 0 | 4740 | 100,00% |
Product 1 | 11 | Saturday | 3 652 | 0 | 3652 | 100,00% |
Product 1 | 11 | Sunday | 2 768 | 0 | 2768 | 100,00% |
Product 1 | 12 | Monday | 4 381 | 4145 | 236 | 5,39% |
Product 1 | 12 | Wednesday | 4 776 | 4625 | 151 | 3,16% |
Product 1 | 12 | Thursday | 5 228 | 4713 | 515 | 9,85% |
Product 1 | 12 | Sunday | 2 502 | 2767 | -265 | -10,59% |
E.g. the row show the values for Product 1, week 12 and Sunday. For this row the column “Quantity” shows the quantity for this day. The column “Quantity (last week)” should show the value from the column Quantity for Product 1, week 11 and Sunday. When I only select one product this works as I want it to do, but if I select more than 1 product this doesn’t work:
Product | Weeknumber | Weekday | Quantity | Quantity (last week) | Diff | Diff (%) |
Product 1 | 11 | Monday | 4 146 | 0 | 4146 | 100,00% |
Product 1 | 11 | Tuesday | 4 506 | 0 | 4506 | 100,00% |
Product 1 | 11 | Wednesday | 4 626 | 0 | 4626 | 100,00% |
Product 1 | 11 | Thursday | 4 714 | 0 | 4714 | 100,00% |
Product 1 | 11 | Friday | 4 740 | 0 | 4740 | 100,00% |
Product 1 | 11 | Saturday | 3 652 | 0 | 3652 | 100,00% |
Product 1 | 11 | Sunday | 2 768 | 0 | 2768 | 100,00% |
Product 1 | 12 | Monday | 4 381 | 4145 | 236 | 5,39% |
Product 1 | 12 | Wednesday | 4 776 | 4505 | 271 | 5,67% |
Product 1 | 12 | Thursday | 5 228 | 4625 | 603 | 11,53% |
Product 1 | 12 | Sunday | 2 502 | 4713 | -2211 | -88,37% |
Product 2 | 11 | Monday | 4 599 | 0 | 4599 | 100,00% |
Product 2 | 11 | Tuesday | 4 893 | 0 | 4893 | 100,00% |
Product 2 | 11 | Wednesday | 5 115 | 0 | 5115 | 100,00% |
Product 2 | 11 | Thursday | 5 151 | 0 | 5151 | 100,00% |
Product 2 | 11 | Friday | 5 531 | 0 | 5531 | 100,00% |
Product 2 | 11 | Saturday | 4 335 | 0 | 4335 | 100,00% |
Product 2 | 11 | Sunday | 3 080 | 0 | 3080 | 100,00% |
Product 2 | 12 | Monday | 4 841 | 4598 | 243 | 5,02% |
Product 2 | 12 | Tuesday | 4 954 | 4892 | 62 | 1,25% |
Product 2 | 12 | Wednesday | 5 323 | 5114 | 209 | 3,93% |
Product 2 | 12 | Thursday | 5 933 | 5150 | 783 | 13,20% |
Product 2 | 12 | Friday | 4 047 | 5530 | -1483 | -36,64% |
Product 2 | 12 | Saturday | 4 300 | 4334 | -34 | -0,79% |
When I select more than one product and we don’t have any sales during one day, the value in the column “Quantity (last week)” shows the value from the previous day last week. E.g. the row show the values for Product 1, week 12 and Sunday. For this row the column “Quantity” shows the quantity for this day. The column “Quantity (last week)” should show the value from the column Quantity for Product 1, week 11 and Sunday, but it shows the quantity from the row Product 1, week 11, Thursday, because we do not have any sales for either Friday or Saturday. Do you have any idea of how I can solve this? I use this expression to calculate the value in the column “Quantity (last week)”:
aggr(Above(sum({1}0)+ sum({$<Date>}Quantity), 7), Product,Date)
Best Regards
Helena
Accepted Solutions
- Mark as New
- Bookmark
- Subscribe
- Mute
- Subscribe to RSS Feed
- Permalink
- Report Inappropriate Content
I tried to create a sample from the data you have provided. Isn't this what you are looking to get?
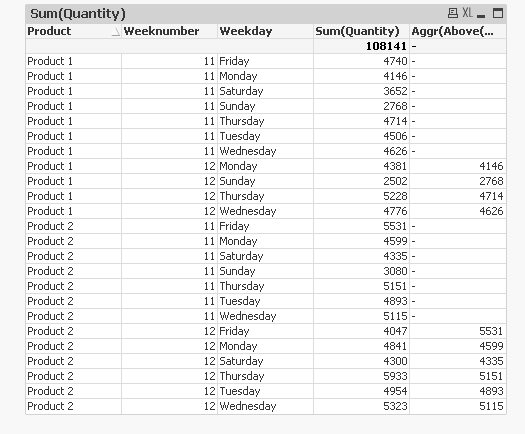
For this sample, since I didn't have the date field, I used this expression
Aggr(Above(Sum({1}0) + Sum({<Weekday, Weeknumber>}Quantity)), Product, Weekday, (Weeknumber, (NUMERIC)))
- Mark as New
- Bookmark
- Subscribe
- Mute
- Subscribe to RSS Feed
- Permalink
- Report Inappropriate Content
May be try this
Aggr(Above(Sum({1}0) + Sum({$<Date>}Quantity)), Product, Weekday, Weeknumber)
Where I am hoping that Weeknumber is sorted in ascending order in the script... or you can use this if you have QV12 or above
Aggr(Above(Sum({1}0) + Sum({$<Date>}Quantity)), Product, Weekday, (Weeknumber, (NUMERIC)))
- Mark as New
- Bookmark
- Subscribe
- Mute
- Subscribe to RSS Feed
- Permalink
- Report Inappropriate Content
That doesn't work. And I have also tried to sort on date in numeric order in the Aggr-function.
- Mark as New
- Bookmark
- Subscribe
- Mute
- Subscribe to RSS Feed
- Permalink
- Report Inappropriate Content
Do you have QV12 or above?
- Mark as New
- Bookmark
- Subscribe
- Mute
- Subscribe to RSS Feed
- Permalink
- Report Inappropriate Content
Yes, I have QV12. I think that I can solve this by creating an instance for each product and date (even for those combinations that doesn't exists), but I hope that I can do this in the chart instead.
Thanks for your help!
- Mark as New
- Bookmark
- Subscribe
- Mute
- Subscribe to RSS Feed
- Permalink
- Report Inappropriate Content
Would you be able to share a qvw sample for me to test out this?
- Mark as New
- Bookmark
- Subscribe
- Mute
- Subscribe to RSS Feed
- Permalink
- Report Inappropriate Content
I tried to create a sample from the data you have provided. Isn't this what you are looking to get?
For this sample, since I didn't have the date field, I used this expression
Aggr(Above(Sum({1}0) + Sum({<Weekday, Weeknumber>}Quantity)), Product, Weekday, (Weeknumber, (NUMERIC)))
- Mark as New
- Bookmark
- Subscribe
- Mute
- Subscribe to RSS Feed
- Permalink
- Report Inappropriate Content
Thank you. That is what I'm trying to do. I will test your expression and hopefully I will get the same result as you. 
- Mark as New
- Bookmark
- Subscribe
- Mute
- Subscribe to RSS Feed
- Permalink
- Report Inappropriate Content
I gave the same expression before but that didn’t work for you. Not sure if it will work this time or not.
- Mark as New
- Bookmark
- Subscribe
- Mute
- Subscribe to RSS Feed
- Permalink
- Report Inappropriate Content
The last expression works. The difference between this and the previous one is that the last expression is grouped by Weekday and Weeknumber, but the previous expression was just grouped by Date.
Thanks for your help!