Unlock a world of possibilities! Login now and discover the exclusive benefits awaiting you.
- Qlik Community
- :
- All Forums
- :
- QlikView App Dev
- :
- Re: Access point Issue
- Subscribe to RSS Feed
- Mark Topic as New
- Mark Topic as Read
- Float this Topic for Current User
- Bookmark
- Subscribe
- Mute
- Printer Friendly Page
- Mark as New
- Bookmark
- Subscribe
- Mute
- Subscribe to RSS Feed
- Permalink
- Report Inappropriate Content
Access point Issue
Hi All,
We had a issue in the access point view with data display.
We are able view the scale in the bar chart before deployed into access point. the below image is the view of scale.
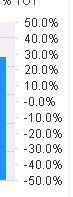
We are not able to view the above scale image in the access point after deployed. the below is the image in access point view.

We have deleted the shared file also but still it is not showing correctly in the access point. MayilVahananjagan MRKachhiaIMP
thanks
Avinash
- « Previous Replies
-
- 1
- 2
- Next Replies »
- Mark as New
- Bookmark
- Subscribe
- Mute
- Subscribe to RSS Feed
- Permalink
- Report Inappropriate Content
Hi,
Try like this
Access point -> Click View Details link of the corresponding Dashboard -> Click Remove last Document state button.
This will clear the cache.
Hope this helps you.
Regards,
jagan.
- Mark as New
- Bookmark
- Subscribe
- Mute
- Subscribe to RSS Feed
- Permalink
- Report Inappropriate Content
Hi Avinash,
It is also important that which client are you using to view the dashboard.
if it is Ajax, then this type of problem happens sometimes. It is always recommended to use IE plugin in Internet explorer.
- Mark as New
- Bookmark
- Subscribe
- Mute
- Subscribe to RSS Feed
- Permalink
- Report Inappropriate Content
hi Jagan,
We tried the above steps but still it is not showing correctly.
please let me know some more options to check.
Thanks
Avinash
- Mark as New
- Bookmark
- Subscribe
- Mute
- Subscribe to RSS Feed
- Permalink
- Report Inappropriate Content
hi Karthik,
We are not able to open in IE plugin due to heavy size of application. We are using google chrome only for opening application in Access point.
thanks
Avinash
- Mark as New
- Bookmark
- Subscribe
- Mute
- Subscribe to RSS Feed
- Permalink
- Report Inappropriate Content
Hi,
Try to clear your browser cache and once log out and login .
Hope this Helps,
Regards,
HirisH
- Mark as New
- Bookmark
- Subscribe
- Mute
- Subscribe to RSS Feed
- Permalink
- Report Inappropriate Content
try resetting the .shared file that should solve the issue ..but you will loss the bookmarks
- Mark as New
- Bookmark
- Subscribe
- Mute
- Subscribe to RSS Feed
- Permalink
- Report Inappropriate Content
Hi Avinash,
Thanks for your reply,
We already tried with this option, But it did not solved this issue.
Thanks
Avinash
- Mark as New
- Bookmark
- Subscribe
- Mute
- Subscribe to RSS Feed
- Permalink
- Report Inappropriate Content
Scales usually follow the data that is to be displayed. Your aggregated data may be different in the AP than in QV Desktop. Does the Server reload load from a different data source? Are you using Section Access/Data reduction?
Can you add a few text boxes in the AP, that show the min/max values in your chart? Or a straight table with the same values per dimension value?
- Mark as New
- Bookmark
- Subscribe
- Mute
- Subscribe to RSS Feed
- Permalink
- Report Inappropriate Content
All the users facing this issue? or only few ??
- « Previous Replies
-
- 1
- 2
- Next Replies »