Unlock a world of possibilities! Login now and discover the exclusive benefits awaiting you.
- Qlik Community
- :
- All Forums
- :
- QlikView App Dev
- :
- Re: Acumulado 12 Meses
- Subscribe to RSS Feed
- Mark Topic as New
- Mark Topic as Read
- Float this Topic for Current User
- Bookmark
- Subscribe
- Mute
- Printer Friendly Page
- Mark as New
- Bookmark
- Subscribe
- Mute
- Subscribe to RSS Feed
- Permalink
- Report Inappropriate Content
Accumulated 12 Months (Acumulado 12 Meses)
Hello Community,
I have the following to generate a line graph
| Month year | % Claims | Accumulated |
| Jun 2014 | 0,52 | |
| Jul 2014 | 0,60 | 0,60 |
| Ago 2014 | 0,62 | 0,56 |
| Sep 2014 | 0,86 | 0,58 |
| Oct 2014 | 0,69 | 0,65 |
| Nov 2014 | 0,73 | 0,66 |
| Dic 2014 | 0,67 | 0,67 |
| One 2015 | 0,70 | 0,67 |
| Feb 2015 | 0,58 | 0,67 |
| Mar 2015 | 0,60 | 0,66 |
| Abr 2015 | 0,77 | 0,66 |
| May 2015 | 0,58 | 0,67 |
| Jun 2015 | 0,63 | 0,66 |
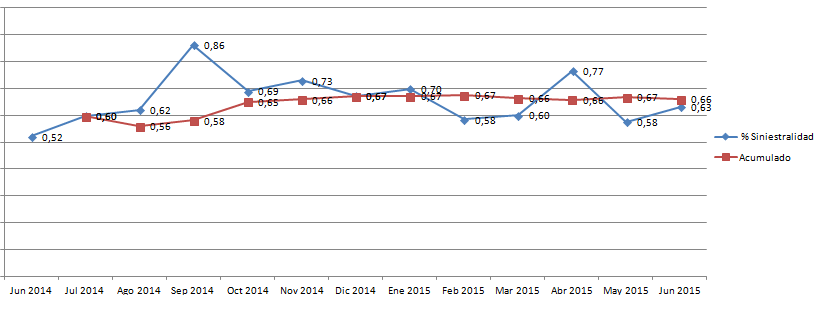
and the graph should look like this: See Figure 1

in the analysis of sets I have the following to the accumulated:
Rangesum(Above(sum({<Año=,Mes=,MesAño={'<=$(=max(MesAño))>=$(=addmonths(max(MesAño),-12))'}>}incu)))
/
Rangesum(Above(sum({<Año=,Mes=,MesAño={'<=$(=max(MesAño))>=$(=addmonths(max(MesAño),-12))'}>}Vlr)))
and when graphing me becomes: See grafica2

the en accumulated analysis brings me the value of the immediately previous month, not cumulative, not that I'm doing wrong in the analysis of sets, we appreciate your help.
Translated with Google Translate - Qlik Community Administrative Team
Hola Comunidad,
tengo los siguientes datos para genera una gráfico de lineas
| MesAño | % Siniestralidad | Acumulado |
| Jun 2014 | 0,52 | |
| Jul 2014 | 0,60 | 0,60 |
| Ago 2014 | 0,62 | 0,56 |
| Sep 2014 | 0,86 | 0,58 |
| Oct 2014 | 0,69 | 0,65 |
| Nov 2014 | 0,73 | 0,66 |
| Dic 2014 | 0,67 | 0,67 |
| Ene 2015 | 0,70 | 0,67 |
| Feb 2015 | 0,58 | 0,67 |
| Mar 2015 | 0,60 | 0,66 |
| Abr 2015 | 0,77 | 0,66 |
| May 2015 | 0,58 | 0,67 |
| Jun 2015 | 0,63 | 0,66 |
y la grafica debe quedar asi: Ver grafica 1
en el análisis de conjuntos tengo lo siguiente para el acumulado:
Rangesum(Above(sum({<Año=,Mes=,MesAño={'<=$(=max(MesAño))>=$(=addmonths(max(MesAño),-12))'}>}incu)))
/
Rangesum(Above(sum({<Año=,Mes=,MesAño={'<=$(=max(MesAño))>=$(=addmonths(max(MesAño),-12))'}>}Vlr)))
y al realizar la gráfica me queda así: Ver grafica2
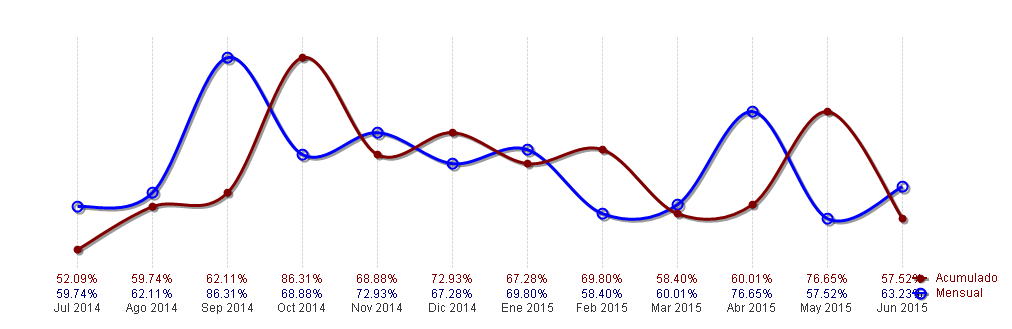
la linea de análisis acumulado me trae el valor del mes inmediatamente anterior, y no el acumulado, no se que estoy haciendo mal en el análisis de conjuntos , les agradezco mucho su ayuda.
- Tags:
- new_to_qlikview
- Mark as New
- Bookmark
- Subscribe
- Mute
- Subscribe to RSS Feed
- Permalink
- Report Inappropriate Content
alguna idea de que estoy haciendo mal???
Gracias
- Mark as New
- Bookmark
- Subscribe
- Mute
- Subscribe to RSS Feed
- Permalink
- Report Inappropriate Content
Hola como estas?
Podras subir el qvw de ejemplo para que sea mas facil ayudarte
saludos, Fernando
- Mark as New
- Bookmark
- Subscribe
- Mute
- Subscribe to RSS Feed
- Permalink
- Report Inappropriate Content
Hola fernando, no me es posible subirlo, pero dime que mas datos necesitas? el tema es que el set de analisis no me esta acumulando, sino que me esta mostrando lo del mes anterior......
- Mark as New
- Bookmark
- Subscribe
- Mute
- Subscribe to RSS Feed
- Permalink
- Report Inappropriate Content
Buenas,
te paso como lo calculo yo en un grafico y anda ok
sum({$<Año = {$(=max(Año))}, Mes = {"<=$(=max({<Año={$(=max(Año))}>} Mes))"}>} [Cantidad Despachada]/1000)
suerte!
Fernando
- Mark as New
- Bookmark
- Subscribe
- Mute
- Subscribe to RSS Feed
- Permalink
- Report Inappropriate Content
No he encontrado solución, alguna idea? gracias