Unlock a world of possibilities! Login now and discover the exclusive benefits awaiting you.
- Qlik Community
- :
- All Forums
- :
- QlikView App Dev
- :
- Accumulated sums for year and month
- Subscribe to RSS Feed
- Mark Topic as New
- Mark Topic as Read
- Float this Topic for Current User
- Bookmark
- Subscribe
- Mute
- Printer Friendly Page
- Mark as New
- Bookmark
- Subscribe
- Mute
- Subscribe to RSS Feed
- Permalink
- Report Inappropriate Content
Accumulated sums for year and month
Hi guys,
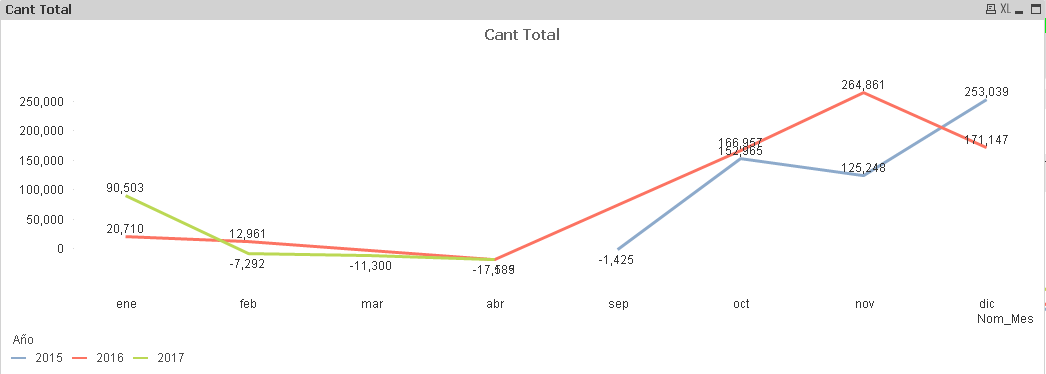
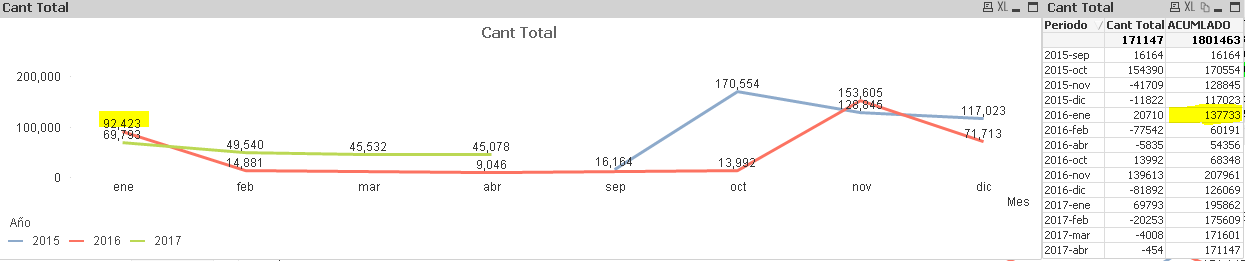
I have accumulated amounts per period but what I require is to be able to visualize it in a chart of lines analyzed for months and years, but when going to the chart at line type does not work as shown in the table chart. Please, someone can help me how to solve this problem?
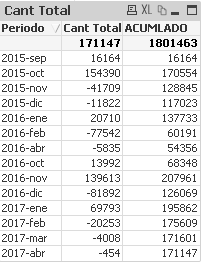
For example for the period January 2016 my result in the point of the graph should be 137733 and not 20710 as it appears in the graph.
Thank you so much.
- « Previous Replies
-
- 1
- 2
- Next Replies »
Accepted Solutions
- Mark as New
- Bookmark
- Subscribe
- Mute
- Subscribe to RSS Feed
- Permalink
- Report Inappropriate Content
- Mark as New
- Bookmark
- Subscribe
- Mute
- Subscribe to RSS Feed
- Permalink
- Report Inappropriate Content
can you please post your expression used
- Mark as New
- Bookmark
- Subscribe
- Mute
- Subscribe to RSS Feed
- Permalink
- Report Inappropriate Content
That's make sense only but it's tough to explain and solve
- Mark as New
- Bookmark
- Subscribe
- Mute
- Subscribe to RSS Feed
- Permalink
- Report Inappropriate Content
rangesum(above(total sum([Ctd.en UM entrada]),0, rowno(total)))
- Mark as New
- Bookmark
- Subscribe
- Mute
- Subscribe to RSS Feed
- Permalink
- Report Inappropriate Content
if you are doing the accumulation in chart expression, it works according to the chart dimensions, so each dimension value (year) accumulates from the first entry (Jan).
You have not stated how you are doing the accumulation or the expression, but you may need a RangeSum(Above TOTAL....)) type expression to accumulate the way you want, or else do the accumulation in the load script.
- Mark as New
- Bookmark
- Subscribe
- Mute
- Subscribe to RSS Feed
- Permalink
- Report Inappropriate Content
Try this
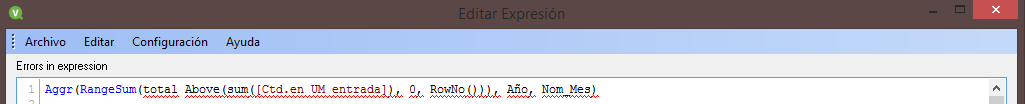
Aggr(RangeSum(total Above(sum([Ctd.en UM entrada]), 0, RowNo())), Year, Month)
or
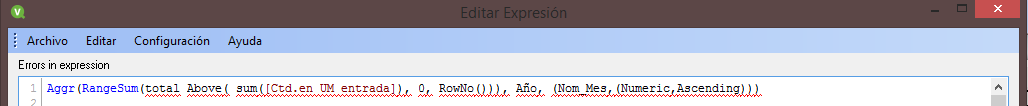
Aggr(RangeSum(total Above(sum([Ctd.en UM entrada]), 0, RowNo())), Year, (Month,(Numeric,Ascending))) this if you are using QLIKVIEW VERSION 12
- Mark as New
- Bookmark
- Subscribe
- Mute
- Subscribe to RSS Feed
- Permalink
- Report Inappropriate Content
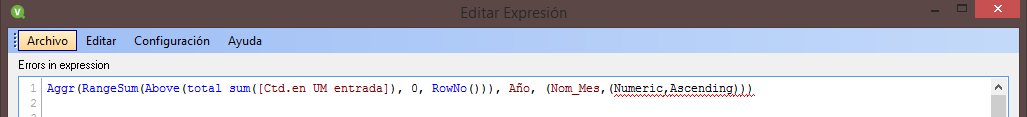
Queries do not work 
But in the following way if they work
But still the graph does not reflect what I need 
- Mark as New
- Bookmark
- Subscribe
- Mute
- Subscribe to RSS Feed
- Permalink
- Report Inappropriate Content
Sorry try this
Aggr(RangeSum(Above(total sum([Ctd.en UM entrada]), 0, RowNo())), Year, (Month,(Numeric,Ascending)))
It will be in red but should be evaluating the expression
- Mark as New
- Bookmark
- Subscribe
- Mute
- Subscribe to RSS Feed
- Permalink
- Report Inappropriate Content
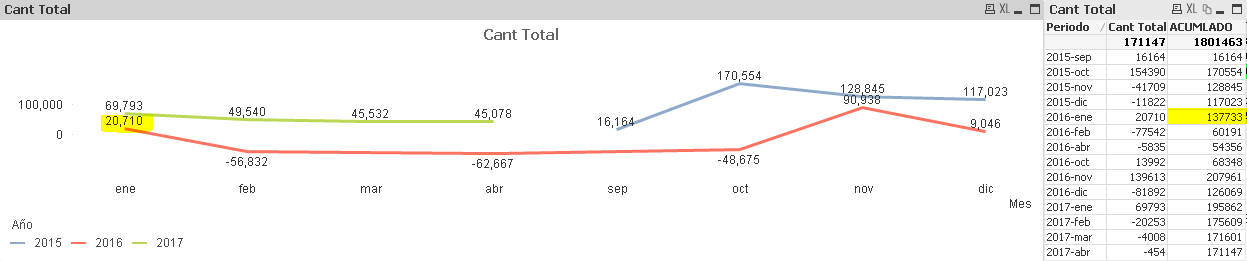
The same friend,
- Mark as New
- Bookmark
- Subscribe
- Mute
- Subscribe to RSS Feed
- Permalink
- Report Inappropriate Content
Hi jontydkpi,
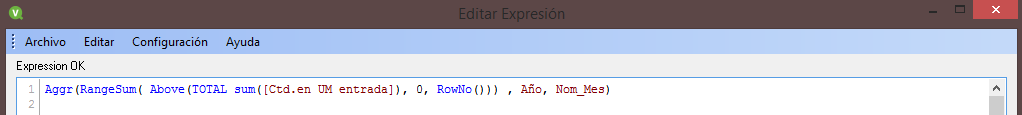
I used this query:
rangesum(above(total sum([Ctd.en UM entrada]),0, rowno(total)))
But still the graph does not reflect what I need.
Now the problem is that the accumulated must be dynamic based on the filters they perform, which is why I do not think the script can be done.
- « Previous Replies
-
- 1
- 2
- Next Replies »