Unlock a world of possibilities! Login now and discover the exclusive benefits awaiting you.
- Qlik Community
- :
- All Forums
- :
- QlikView App Dev
- :
- Accumulating in pivot Table considering not select...
- Subscribe to RSS Feed
- Mark Topic as New
- Mark Topic as Read
- Float this Topic for Current User
- Bookmark
- Subscribe
- Mute
- Printer Friendly Page
- Mark as New
- Bookmark
- Subscribe
- Mute
- Subscribe to RSS Feed
- Permalink
- Report Inappropriate Content
Accumulating in pivot Table considering not selected dates in filters
Hi folks,
I have the following scenario:
- Pivot table using accumulating concept: It works!

- What am I trying?
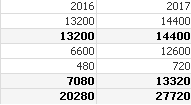
- When selecting 2016 and 2017 periods, I want to consider 2015 in the calculation in order to have the correct accumulated amount. \however, I'm getting this:

in instead of this (what I want):

As I see it, it might be a piece of cake for you experts.
Thanks in advance.
Rubens
- Mark as New
- Bookmark
- Subscribe
- Mute
- Subscribe to RSS Feed
- Permalink
- Report Inappropriate Content
Try this
RangeSum(Before(Sum({<Year>}Value), 0, ColumnNo())) * Avg(1)
- Mark as New
- Bookmark
- Subscribe
- Mute
- Subscribe to RSS Feed
- Permalink
- Report Inappropriate Content
Great Sunny,
Another question:
- In my case, I want to ommit 2015 in a dimension level. However, I still want to see the the accumulated amountt considering 2015. Should I iterate on a dimension level?
Tks,
Rubens
- Mark as New
- Bookmark
- Subscribe
- Mute
- Subscribe to RSS Feed
- Permalink
- Report Inappropriate Content
May be like this
RangeSum(Before(Sum({<Year>}Value), 0, ColumnNo())) * Avg({<Year = {'2016', '2017'}>}1)
or if you still want Year selections to be honored
RangeSum(Before(Sum({<Year>}Value), 0, ColumnNo())) * Avg({<Year *= {'2016', '2017'}>}1)
If you want the 2016 and 2017 to be dynamic
RangeSum(Before(Sum({<Year>}Value), 0, ColumnNo())) * Avg({<Year = {$(=Max(Year)), $(=Max(Year)-1)}>}1)
or
RangeSum(Before(Sum({<Year>}Value), 0, ColumnNo())) * Avg({<Year = {$(=Year(Today())), $(=Year(Today())-1)}>}1)
- Mark as New
- Bookmark
- Subscribe
- Mute
- Subscribe to RSS Feed
- Permalink
- Report Inappropriate Content
The problem with this logic is 2015 is still being shown in the chart. Furthermore, I have to freeze how many years I want to consider in the chatt.
I need something like this:


I need a chart like above, but accumulating from the past no selected periods.
Tks mate!
- Mark as New
- Bookmark
- Subscribe
- Mute
- Subscribe to RSS Feed
- Permalink
- Report Inappropriate Content
Looks like it is working...
Are you not seeing this?