Unlock a world of possibilities! Login now and discover the exclusive benefits awaiting you.
- Qlik Community
- :
- All Forums
- :
- QlikView App Dev
- :
- Re: Add Dimension labels to a stacked bar chart fo...
- Subscribe to RSS Feed
- Mark Topic as New
- Mark Topic as Read
- Float this Topic for Current User
- Bookmark
- Subscribe
- Mute
- Printer Friendly Page
- Mark as New
- Bookmark
- Subscribe
- Mute
- Subscribe to RSS Feed
- Permalink
- Report Inappropriate Content
Add Dimension labels to a stacked bar chart for gantt cart
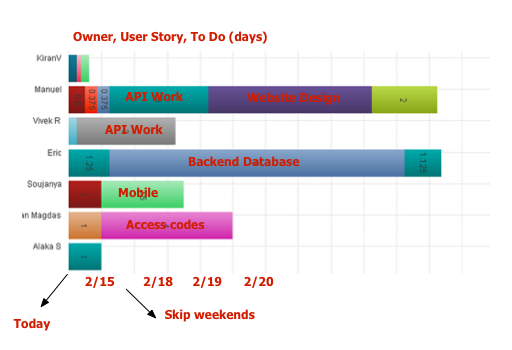
I am builiding a quasi gantt chart using the bar chart in Qlikview. I don't need something as complex as a gantt chart, but something that basically shows Engieer name, Different user stories they are working on and Number of days it will take....This data model basicall has these fields:
Owner (dimension)
User Story (dimension)
To Do (number of days to complete the story)
Difficult task #1
I would like to display this data as number of days as Calendar dates always starting with today as the baseline. Right now, it is in Number of days, an integer not a date value
Difficult task #2
I would also like to display the text of the dimension (User Story) within the stacked bar chart. Right now I am displaying the Sum of the number of days for each Owner/User Story.
Difficult Task #3
I would like to skip weekends, and count only working days.
Please see my sketch to get a clearer picture, any suggestions very much appreciated!
- Mark as New
- Bookmark
- Subscribe
- Mute
- Subscribe to RSS Feed
- Permalink
- Report Inappropriate Content
Task 1: You can build the dates into your datamodel, whereby you have a calendar and you assign flags of 1 or 0 for each day that an owner is involved in the project. You can then have date and owner as the primary and secondary dimensions and a sum of the flag to indicate work being done on the project.
Task 2: Tick Expressions > Values on datapoints, and also tick Presentation > Plot values inside segments
Task 3: You can change your date dimension (press Edit) to use the NetWorkDays() function, something like:
=if(NetWorkDays(TransDate,TransDate)=1,TransDate)
Hope this helps.
Jonathan
- Mark as New
- Bookmark
- Subscribe
- Mute
- Subscribe to RSS Feed
- Permalink
- Report Inappropriate Content
This is very helpful, thank you.
Can you please provide some guidance on this script, I'm very new to QV scripting so I don't really know where to begin.
Bascially, I would need a script that does this (in pseudo code)
FOR each owner in table rally
day = Today()
FOR each user_story
FOR each task
if day is weekday
new.owner = owner
new.user_story = user_story
new.task = task
new.to_do_flag = 1
else
new.owner = owner
new.user_story = user_story
new.task = task
new.to_do_flag = 0
end
day = day +1
END
END
END
- Mark as New
- Bookmark
- Subscribe
- Mute
- Subscribe to RSS Feed
- Permalink
- Report Inappropriate Content
Your pseduo code would be possible within QlikView scripting, but would be using a hammer to crack a nut. To do this through more standard datamodel scripting, whereby you create tables and then manipulate them, you can:
1. create a master calendar that has an uninterrupted set of dates from a set min to max date.... either search for 'master calendar' or check out a post such as this one ...http://community.qlik.com/thread/48693
2. build a table of projects (or in your case project involvement) that sets up the projects, the owners and their start and end dates
3. create a linking table between the calendar and the project involvement tables, that contains one record for each day that a user is involved on a project. Within this table you could have the flag I mentioned that can then be summed up. This can be done using a command called 'interval match', which is discussed in the reference manual.
I can't provide code for this at the moment, but if you have a problem and I can try to provide some later in the week.
Jonathan