Unlock a world of possibilities! Login now and discover the exclusive benefits awaiting you.
- Qlik Community
- :
- All Forums
- :
- QlikView App Dev
- :
- Re: Add color expression to Bar Chart
- Subscribe to RSS Feed
- Mark Topic as New
- Mark Topic as Read
- Float this Topic for Current User
- Bookmark
- Subscribe
- Mute
- Printer Friendly Page
- Mark as New
- Bookmark
- Subscribe
- Mute
- Subscribe to RSS Feed
- Permalink
- Report Inappropriate Content
Add color expression to Bar Chart
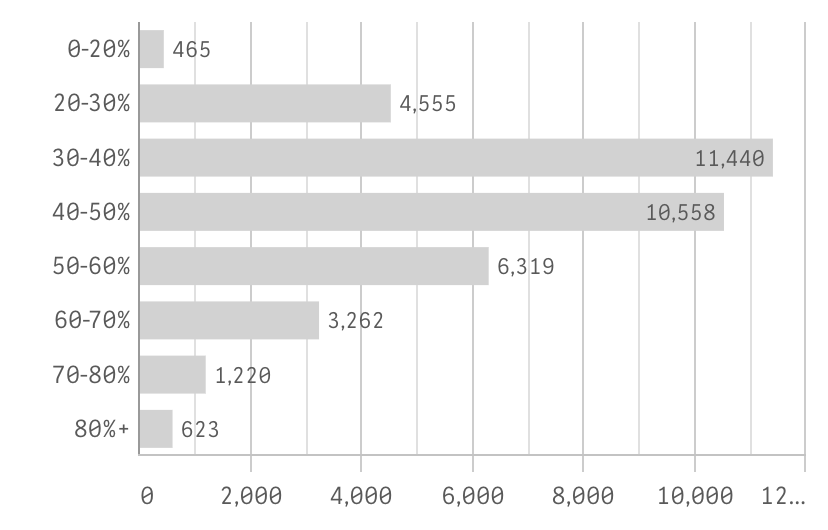
I'm trying to implement specific colors to a Bar chart which is binned using a dual expression as a dimension. The expression to create the dimension is listed below and I'm using an measure to count the number of records. I would like to apply a different RGB color (Green / Yellow / Red) to each bin in the below chart, but nothing is working to add a color as an expression.
If(Ratio<=.2, Dual('0-20%',2),
If(Ratio<=.3, Dual('20-30%',4),
If(Ratio<=.4, Dual('30-40%',6),
If(Ratio<=.5, Dual('40-50%',8),
If(Ratio<=.6, Dual('50-60%',10),
If(Ratio<=.7, Dual('60-70%',30),
IF(Ratio <= .8, Dual('70-80%',40),
Dual('80%+',50))))))))

Accepted Solutions
- Mark as New
- Bookmark
- Subscribe
- Mute
- Subscribe to RSS Feed
- Permalink
- Report Inappropriate Content
Try this
If(Max(Ratio)<=.2, LightMagenta(),
If(Max(Ratio)<=.3, Blue(),
If(Max(Ratio)<=.4, Green(),
If(Max(Ratio)<=.5, Red(),
If(Max(Ratio)<=.6, LightGray(),
If(Max(Ratio)<=.7, Brown(),
IF(Max(Ratio) <= .8, Yellow(),
LightCyan())))))))
- Mark as New
- Bookmark
- Subscribe
- Mute
- Subscribe to RSS Feed
- Permalink
- Report Inappropriate Content
Something like this in the background color for the expression isn't working?
If(Ratio<=.2, LightRed(),
If(Ratio<=.3, Blue(),
If(Ratio<=.4, Green(),
If(Ratio<=.5, Color4,
If(Ratio<=.6, Color5,
If(Ratio<=.7, Color6,
IF(Ratio <= .8, Color7,
Color8)))))))
- Mark as New
- Bookmark
- Subscribe
- Mute
- Subscribe to RSS Feed
- Permalink
- Report Inappropriate Content
Yeah that was my exact thought, but whenever I apply this approach to the color expression every bar is grey like the example screenshot. Perhaps I need to bin the data differently and not use the dual method as the dimension? I'm not sure how else to custom bin the data in the bar chart.
- Mark as New
- Bookmark
- Subscribe
- Mute
- Subscribe to RSS Feed
- Permalink
- Report Inappropriate Content
Try this
If(Max(Ratio)<=.2, LightMagenta(),
If(Max(Ratio)<=.3, Blue(),
If(Max(Ratio)<=.4, Green(),
If(Max(Ratio)<=.5, Red(),
If(Max(Ratio)<=.6, LightGray(),
If(Max(Ratio)<=.7, Brown(),
IF(Max(Ratio) <= .8, Yellow(),
LightCyan())))))))
- Mark as New
- Bookmark
- Subscribe
- Mute
- Subscribe to RSS Feed
- Permalink
- Report Inappropriate Content
Can you share sample application, Seems you are taking Dimension as Color, May be try the same in Expression BG Color
- Mark as New
- Bookmark
- Subscribe
- Mute
- Subscribe to RSS Feed
- Permalink
- Report Inappropriate Content
Yep - adding the Max function worked. Thanks for the tip.
- Mark as New
- Bookmark
- Subscribe
- Mute
- Subscribe to RSS Feed
- Permalink
- Report Inappropriate Content
how can it work on max function, tell me in this situation