Unlock a world of possibilities! Login now and discover the exclusive benefits awaiting you.
- Qlik Community
- :
- All Forums
- :
- QlikView App Dev
- :
- Re: Add total for dimension in table
- Subscribe to RSS Feed
- Mark Topic as New
- Mark Topic as Read
- Float this Topic for Current User
- Bookmark
- Subscribe
- Mute
- Printer Friendly Page
- Mark as New
- Bookmark
- Subscribe
- Mute
- Subscribe to RSS Feed
- Permalink
- Report Inappropriate Content
Add total for dimension in table
Hi,
Say I have a data structure that looks like:
Load * Inline
[
Client,Spend,Receive,From
A,2,5,D
A,4,5,D
A,1,7,D
A,2,6,E
A,4,7,E
A,1,2,E
B,2,2,D
B,1,4,D
B,5,7,D
B,2,6,E
B,1,7,E
B,5,7,E
C,3,4,D
C,8,9,D
C,7,3,D
C,3,5,E
C,8,6,E
C,7,1,E];
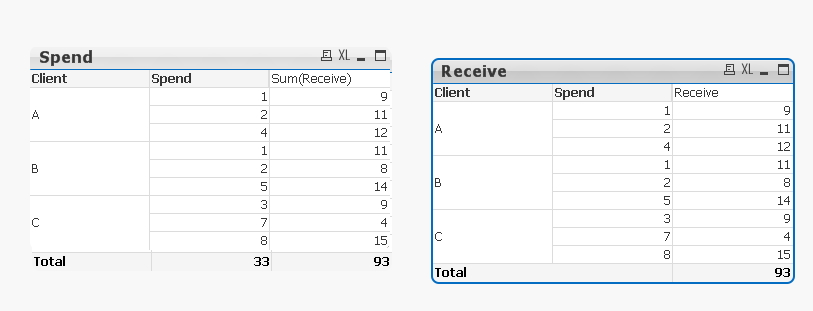
And I have a pivot table with dimensions Client and Spend and expression Sum(Receive). At the bottom of the chart I want to show a total for Spend. Is this possible? And, if so, how can I do it?
I've attached an example to help illustrate my question.
Thanks and best,
Ryan
- Mark as New
- Bookmark
- Subscribe
- Mute
- Subscribe to RSS Feed
- Permalink
- Report Inappropriate Content
As per as I know it is difficult to do that.
I tried different approach by taking two objects. Have a look and see if you can do the same.
(1) Pivot table for showing data
(2) Straight table to show the total at bottom.
Basically you need cover bottom report with top by using layout --> Layer
- Mark as New
- Bookmark
- Subscribe
- Mute
- Subscribe to RSS Feed
- Permalink
- Report Inappropriate Content
Hello,
sory, but my license ended 
Do you expect 33 or rather 66 as sum of Spend?
regards
Darek
- Mark as New
- Bookmark
- Subscribe
- Mute
- Subscribe to RSS Feed
- Permalink
- Report Inappropriate Content
33
- Mark as New
- Bookmark
- Subscribe
- Mute
- Subscribe to RSS Feed
- Permalink
- Report Inappropriate Content
No ideal ....
It is also possible to have it in 'Spend' Label field.
But to have it under Spend dimension column, i think only chiru.thota solution will work
Unfortunetely it may be difficult if your user would like to resize or move pivot ....