Unlock a world of possibilities! Login now and discover the exclusive benefits awaiting you.
- Qlik Community
- :
- All Forums
- :
- QlikView App Dev
- :
- Adding data of prev. years or aggregating prev. ye...
- Subscribe to RSS Feed
- Mark Topic as New
- Mark Topic as Read
- Float this Topic for Current User
- Bookmark
- Subscribe
- Mute
- Printer Friendly Page
- Mark as New
- Bookmark
- Subscribe
- Mute
- Subscribe to RSS Feed
- Permalink
- Report Inappropriate Content
Adding data of prev. years or aggregating prev. years data into current year
Hi,
Not sure the subject is relevant. I want to achieve following results:
I have data sampled from past year till this year. But when displaying the data either in a graph or a pivot ,I am displaying only current year and months. For which the appropriate data is getting displayed. What I want is the prev. years data should be aggregated i.e added up into this data and displayed.
In the attached ex. there is a policy count of 117 till dec. 2011. And for month of Jan 2012 the count is 22, for feb 2012 it is 58 and so on...
When the graph is displayed for Jan 2012,Feb 2012 on x axis and policy count on y axis. I could see 22 and 58, there is a 219 policy count shown under no date i.e blank. When I suppress the blanks this count ( 219) disappears. This count of 219 should be added up in the count of jan 2012. as illustrated below.
In the graph I should see for Jan 2012 the count of (219+22=241) for feb 2012 ( 241+58=299) etc.
In the pivot I should see for Jan 2012 and for the dimension (keyagebucket) ( 13+5 = 18) for feb 2012 ( 18+4=22) etc
Please help how can this be achieved.
Thanks
Lax
- Mark as New
- Bookmark
- Subscribe
- Mute
- Subscribe to RSS Feed
- Permalink
- Report Inappropriate Content
Hi,
This expression should be
=Sum(MTD_COUNT_SURRENDERABLE)+Alt(Above(TOTAL [Surr1 policy count]),$(=Sum({1<EXTRACTIONDATE={"<$(=Min(EXTRACTIONDATE))"}>} MTD_COUNT_SURRENDERABLE)))
with the same name of this expression.Here the bold one is label of the same above expression.
Celambarasan
- Mark as New
- Bookmark
- Subscribe
- Mute
- Subscribe to RSS Feed
- Permalink
- Report Inappropriate Content
Hi,
With this exp. it gives incorrect count.
For Year 2011 total count is 117 and for 2012 it is 102. So when I display the pivot or chart for only 2012, I should see 219. With this exp. it is showing count as 336 and 438 or 2011 and 2012 respectively.
Here I also want to know that the way I am displaying the dimension - Year 2012 is correct or incorrect. I am using a IF condition to display only the year 2012.
Rgds,
Lax
- Mark as New
- Bookmark
- Subscribe
- Mute
- Subscribe to RSS Feed
- Permalink
- Report Inappropriate Content
Hi,
Do you have data only in range 2011-2012?Can you check it accumulates all the data before 2012.
Celambarasan
- Mark as New
- Bookmark
- Subscribe
- Mute
- Subscribe to RSS Feed
- Permalink
- Report Inappropriate Content
Hi, this is just sample data I have taken for 2011 and 2012. Actually the data is from 2002.
When I map year(ExtractionDate) with the policy count and use the full accumulation then the graph shows on x axis
all the years since 2002 till 2012 and data gets added up for every subsequent year.
Instead of displaying the graph ( or the pivot) for entire period. I am displaying it only from 2011 onwards i.e 2011 and 2012. with simple expression like sum(MTD_count_surrenderable) I am getting the policy count from 2011 till 2012 correctly.
Issue here is how to get the policies of previous years accounted in 2011. In the link that was shared by you, it seems my problem is also the same, so same solution should work, but might depend on the data model.
If you can download the document along with the data will be helpful, so that you can try at your end. Atleast if you can use the data from this excel to build the test application.
Thanks for your continuous support !
- Mark as New
- Bookmark
- Subscribe
- Mute
- Subscribe to RSS Feed
- Permalink
- Report Inappropriate Content
Hi,
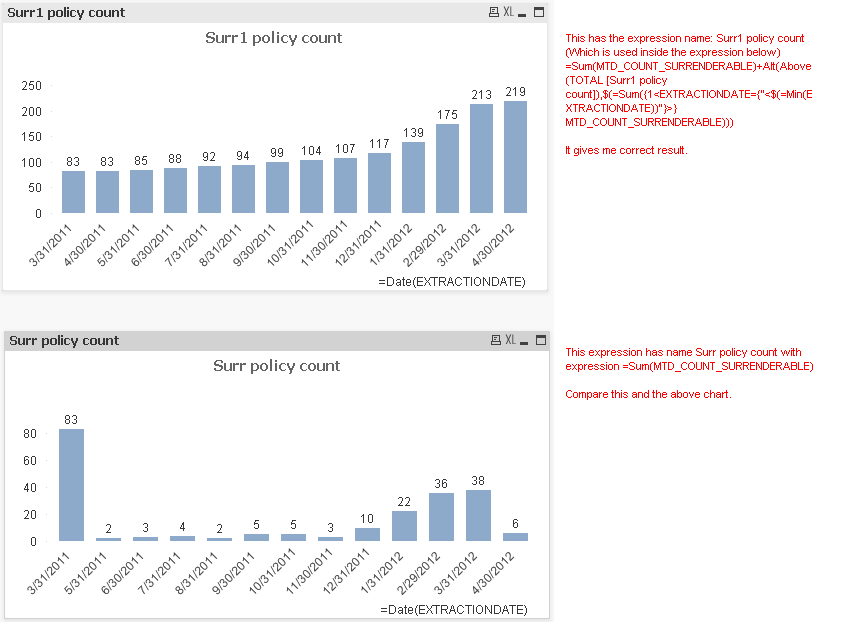
For me the expression shows correct result.
Expression label:Surr1 policy count
Expression : =Sum(MTD_COUNT_SURRENDERABLE)+Alt(Above(TOTAL [Surr1 policy count]),$(=Sum({1<EXTRACTIONDATE={"<$(=Min(EXTRACTIONDATE))"}>} MTD_COUNT_SURRENDERABLE)))
Check the attached image.
Celambarasan
- Mark as New
- Bookmark
- Subscribe
- Mute
- Subscribe to RSS Feed
- Permalink
- Report Inappropriate Content
Hi,
I too get the same result using sum(MTD_COUNT_SURRENDERABLE) and enabling the full accumulation property of the graph.
Issue starts when, In the same graph, I don't want to display previous years. My graph ( or pivot) should start at
1\31\2012 and should display 139 policy count. for 2\29\2012 it should display 175 etc.
Thanks
Lax
- Mark as New
- Bookmark
- Subscribe
- Mute
- Subscribe to RSS Feed
- Permalink
- Report Inappropriate Content
Hi,
Don't enable full accumulation.Check without enabling that option.
Celambarasan
- Mark as New
- Bookmark
- Subscribe
- Mute
- Subscribe to RSS Feed
- Permalink
- Report Inappropriate Content
Hi,
Check with this expression
=Sum({1<EXTRACTIONDATE={">=$(=TimeStamp(YearStart(Max(EXTRACTIONDATE))))"}>}MTD_COUNT_SURRENDERABLE)+Alt(Above(TOTAL [Surr1 policy count]),$(=Sum({1<EXTRACTIONDATE={"<$(=TimeStamp(YearStart(Max(EXTRACTIONDATE))))"}>} MTD_COUNT_SURRENDERABLE)))
Tel me if you have formatted the date field or do you have any other date related fields like year,month etc.
Current year result is based on selection or it will be sames as for all selection?
Celambarasan
- Mark as New
- Bookmark
- Subscribe
- Mute
- Subscribe to RSS Feed
- Permalink
- Report Inappropriate Content
Hi,
Check the attached file.
Celambarasan
- Mark as New
- Bookmark
- Subscribe
- Mute
- Subscribe to RSS Feed
- Permalink
- Report Inappropriate Content
Hi,
This indeed helps but somewhat is hardcoded. What if I am suppose to show the graph from Oct-2011 till Feb 2012, or for past 1 quarter, 2 or 3 quarters etc. In this set analysis the YearStart function is the issue.
Thanks,
Lax