Unlock a world of possibilities! Login now and discover the exclusive benefits awaiting you.
- Qlik Community
- :
- All Forums
- :
- QlikView App Dev
- :
- Re: Adding rows
- Subscribe to RSS Feed
- Mark Topic as New
- Mark Topic as Read
- Float this Topic for Current User
- Bookmark
- Subscribe
- Mute
- Printer Friendly Page
- Mark as New
- Bookmark
- Subscribe
- Mute
- Subscribe to RSS Feed
- Permalink
- Report Inappropriate Content
Adding rows
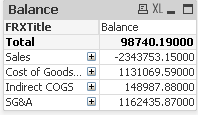
See attachment. I want to take row 1 (Sales) and add to row 2 (Cost of Goods Sold) and get a new row 3 (Gross Profit) How can this be accomplised.
THANKS!!!
Lance
- Tags:
- new_to_qlikview
Accepted Solutions
- Mark as New
- Bookmark
- Subscribe
- Mute
- Subscribe to RSS Feed
- Permalink
- Report Inappropriate Content
Maybe in load script:
Sales + [Cost of Goods Sold] as [Gross Profit],
- Mark as New
- Bookmark
- Subscribe
- Mute
- Subscribe to RSS Feed
- Permalink
- Report Inappropriate Content
Maybe in load script:
Sales + [Cost of Goods Sold] as [Gross Profit],
- Mark as New
- Bookmark
- Subscribe
- Mute
- Subscribe to RSS Feed
- Permalink
- Report Inappropriate Content
Not sure that would work, the sale number and COGS number is made up of many rows. For example, each row contains a field(Title) that assigns it a value of Sales or COGS, I only need the diffenrence between the 2 in the Pivot Table Chart.
- Mark as New
- Bookmark
- Subscribe
- Mute
- Subscribe to RSS Feed
- Permalink
- Report Inappropriate Content
LOAD * INLINE [
FRXTitle, NewFRXTitle
Sales, Sales
Cost of Goods..., Cost of Goods...
Indirect COGS, Indirect COGS
SG&A, SG&A
Sales, Gross Profit
Cost of Goods...,Gross Profit
];
and use NewFRXTitle as a pivot dimension instead of FRXTitle.
In this case you will have sum of the first two rows as Gross Profit row.
- Mark as New
- Bookmark
- Subscribe
- Mute
- Subscribe to RSS Feed
- Permalink
- Report Inappropriate Content
AMAZING!!!! TRULY AMAZING!!! Thanks for your help, I don't even understand what you did, I need to learn more about LOAD * Inline, but it worked perfectly!!!!
- Mark as New
- Bookmark
- Subscribe
- Mute
- Subscribe to RSS Feed
- Permalink
- Report Inappropriate Content
Can I ask one more favor.
Attached is what I have so far, I am getting the % of Sales column with this,
Sum(AccountBalance)/Sum({<NewFRXTitle={Sales}>}total <[CalendarYear]> AccountBalance)
and I am getting the previous year with this
=Sum({$<CalendarYear={$(=Max(CalendarYear)-1)}>}AccountBalance)*-1
Everything works great with that. But I am trying to get the %of Sales for the Previous Year, and it does not work.
Sum 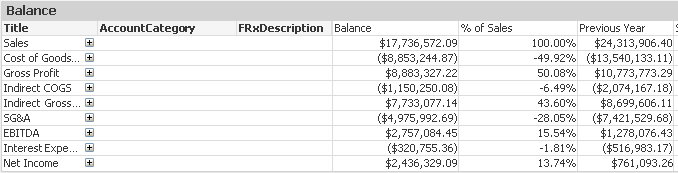 ({$<CalendarYear={$(=Max(CalendarYear)-1)}>} {<NewFRXTitle={Sales}>}TOTAL AccountBalance)
What am I doing wrong?
- Mark as New
- Bookmark
- Subscribe
- Mute
- Subscribe to RSS Feed
- Permalink
- Report Inappropriate Content
What am I doing wrong?
You've used one solution and marked as right another solution.
As for expression, try correct the syntax of set analysis:
Sum ({$<CalendarYear={$(=Max(CalendarYear)-1)}, NewFRXTitle={Sales}>}TOTAL AccountBalance)
or you misstyped the expression ?