Unlock a world of possibilities! Login now and discover the exclusive benefits awaiting you.
- Qlik Community
- :
- All Forums
- :
- QlikView App Dev
- :
- Adhoc reporting
- Subscribe to RSS Feed
- Mark Topic as New
- Mark Topic as Read
- Float this Topic for Current User
- Bookmark
- Subscribe
- Mute
- Printer Friendly Page
- Mark as New
- Bookmark
- Subscribe
- Mute
- Subscribe to RSS Feed
- Permalink
- Report Inappropriate Content
Adhoc reporting
Can any one tell that how to create charts in ADHOC REPORTING.
i want that user will select chart , dimension and expression and accordingly chart will prepare.
please help
- Tags:
- new_to_qlikview
- Mark as New
- Bookmark
- Subscribe
- Mute
- Subscribe to RSS Feed
- Permalink
- Report Inappropriate Content
Hi,
You can get help of the samples file in the Qlikview folder on your system itself
in folder C:\Program Files\QlikView\Examples\Documents application name Whats New in QlikView11.qvw
in reports sheet.
Regards
Anand
- Mark as New
- Bookmark
- Subscribe
- Mute
- Subscribe to RSS Feed
- Permalink
- Report Inappropriate Content
- Mark as New
- Bookmark
- Subscribe
- Mute
- Subscribe to RSS Feed
- Permalink
- Report Inappropriate Content
Hi,
You can get help of this documents also
Re: What is Adhoc? and What are the adhoc features in QlikView?
http://community.qlik.com/docs/DOC-5404
This helps you
Regards
Anand
- Mark as New
- Bookmark
- Subscribe
- Mute
- Subscribe to RSS Feed
- Permalink
- Report Inappropriate Content
dear all i am done with Adhoc reporting but i want to create chart like BAR CHART, Pie Chart, Line Chart etc.
- Mark as New
- Bookmark
- Subscribe
- Mute
- Subscribe to RSS Feed
- Permalink
- Report Inappropriate Content
and this is all should be user friendly like user will select the chart, will select the Dimension and Expression
- Mark as New
- Bookmark
- Subscribe
- Mute
- Subscribe to RSS Feed
- Permalink
- Report Inappropriate Content
HI,
In that case go with QlikSense.
Regards
ASHFAQ
- Mark as New
- Bookmark
- Subscribe
- Mute
- Subscribe to RSS Feed
- Permalink
- Report Inappropriate Content
Hi,
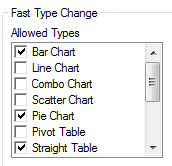
You can get help of Fast change in chart properties >> Fast change >> Select Bar,Straight, Pie
But there is limit of dimension in some chart if you select more dimension chart not created but you can get help of Fast Change.
Regards
Anand
- Mark as New
- Bookmark
- Subscribe
- Mute
- Subscribe to RSS Feed
- Permalink
- Report Inappropriate Content
yes anand there is limitation of Dimension that why i am saying there should be a liability to make chart by user it self