Unlock a world of possibilities! Login now and discover the exclusive benefits awaiting you.
- Qlik Community
- :
- All Forums
- :
- QlikView App Dev
- :
- Re: Advanced Variance in Chart
- Subscribe to RSS Feed
- Mark Topic as New
- Mark Topic as Read
- Float this Topic for Current User
- Bookmark
- Subscribe
- Mute
- Printer Friendly Page
- Mark as New
- Bookmark
- Subscribe
- Mute
- Subscribe to RSS Feed
- Permalink
- Report Inappropriate Content
Advanced Variance in Chart
Hi Guys,
My Requirement seems a bit Complicated. Just See if this is possible.
I have data for sales in the Order
Q4 Budget Q1 Q2 Q3
Now I want the chart to display :
Budget/Q4 Q1/Budget Q2/Budget Q3/Budget.
for Sum(Sales)
Is this possible.?
Accepted Solutions
- Mark as New
- Bookmark
- Subscribe
- Mute
- Subscribe to RSS Feed
- Permalink
- Report Inappropriate Content
- Mark as New
- Bookmark
- Subscribe
- Mute
- Subscribe to RSS Feed
- Permalink
- Report Inappropriate Content
sample data and expected output would help here
- Mark as New
- Bookmark
- Subscribe
- Mute
- Subscribe to RSS Feed
- Permalink
- Report Inappropriate Content
Okay Consider This:
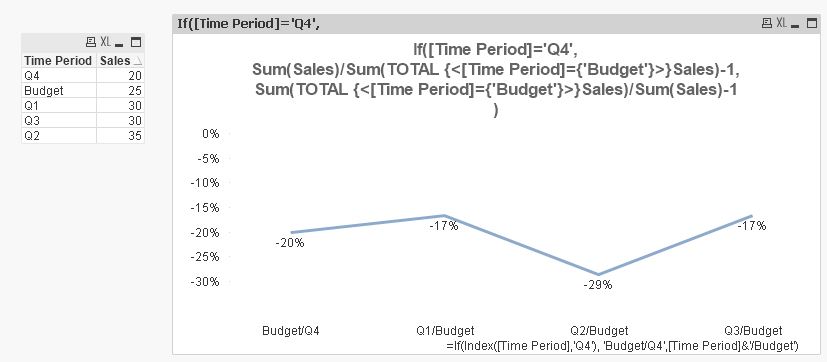
Time Period Sales
---------------- --------
Q4 20
Budget 25
Q1 30
Q2 35
Q3 30
Now I Need a line chart which displays the following four Values (Variance):

- Mark as New
- Bookmark
- Subscribe
- Mute
- Subscribe to RSS Feed
- Permalink
- Report Inappropriate Content
Please check the attached 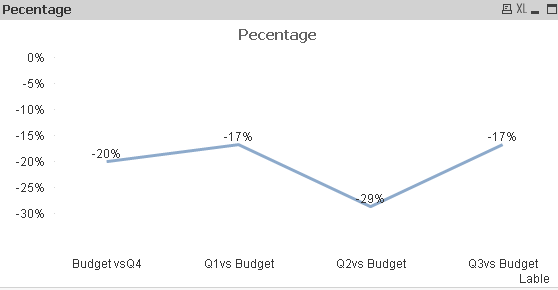
- Mark as New
- Bookmark
- Subscribe
- Mute
- Subscribe to RSS Feed
- Permalink
- Report Inappropriate Content
Hey Varun,
I use a free desktop version of qlikview and i am out of my external qvw limits.
If possible can you share screenshots.
Thank You
- Mark as New
- Bookmark
- Subscribe
- Mute
- Subscribe to RSS Feed
- Permalink
- Report Inappropriate Content
Another UI solution could be like:
- Mark as New
- Bookmark
- Subscribe
- Mute
- Subscribe to RSS Feed
- Permalink
- Report Inappropriate Content
Set vBudget= 25;


Test:
LOAD * INLINE [
    Time, Sales
    Q4, 20
    Q1, 30
    Q2, 35
    Q3, 30
];


Load Time, If(Time = 'Q4', Sales - $(vBudget),$(vBudget)-Sales) as Variance,
If(Time = 'Q4', (Sales - $(vBudget))/$(vBudget),($(vBudget)-Sales)/Sales) as Pecentage,
If(Time = 'Q4','Budget vs'&Time, Time &'vs Budget') as Lable Resident Test;


Drop table Test;
- Mark as New
- Bookmark
- Subscribe
- Mute
- Subscribe to RSS Feed
- Permalink
- Report Inappropriate Content
Thank You Tresesco.
This did it for me.
Wow Qlikview is more Dynamic than I thought.
