Unlock a world of possibilities! Login now and discover the exclusive benefits awaiting you.
- Qlik Community
- :
- All Forums
- :
- QlikView App Dev
- :
- Re: Advice and thoughts on best approach
- Subscribe to RSS Feed
- Mark Topic as New
- Mark Topic as Read
- Float this Topic for Current User
- Bookmark
- Subscribe
- Mute
- Printer Friendly Page
- Mark as New
- Bookmark
- Subscribe
- Mute
- Subscribe to RSS Feed
- Permalink
- Report Inappropriate Content
Advice and thoughts on best approach
Hoping the community can advise and give an example on the best approach to something Im working on.
I have a repository, containing several+ tables that I am measuring data quality on. The data quality information is extractable (all of the metadata - attached as a one table in Excel for this example)
Each table is a set format as in the attachment.
I need to be able to report on the data over time, the problem is that some of the data will only have 1 instance (one table name occurring once) and some will have multiple instances
I need to graph all tables with more than one instance of the name over time by date created.
My questions are
a) The best way to load this data to make it easy to work with, bearing in mind the way I need to deal with it?
b) The best way to show the score of the quality at a given period in time ? (quality = Sum ([Passing Rows])/(Sum ([Passing Rows]) + Sum ([Failing Rows]))
c) any other advice ...
Thanks in advance
Hips
Accepted Solutions
- Mark as New
- Bookmark
- Subscribe
- Mute
- Subscribe to RSS Feed
- Permalink
- Report Inappropriate Content
- Mark as New
- Bookmark
- Subscribe
- Mute
- Subscribe to RSS Feed
- Permalink
- Report Inappropriate Content
Hips, You can use Interval Match feature to achieve this. Please find the docs in the following link. It will help you. http://community.qlik.com/docs/DOC-3557 Regards. Siva
- Mark as New
- Bookmark
- Subscribe
- Mute
- Subscribe to RSS Feed
- Permalink
- Report Inappropriate Content
PFA, Is this what you want? Regards. siva
- Mark as New
- Bookmark
- Subscribe
- Mute
- Subscribe to RSS Feed
- Permalink
- Report Inappropriate Content
Thanks for the quick reply Siva, not sure yet 
Need to take a look..
- Mark as New
- Bookmark
- Subscribe
- Mute
- Subscribe to RSS Feed
- Permalink
- Report Inappropriate Content
Siva how does that work if the data comes from the same table? - do I just load it in using resident?
- Mark as New
- Bookmark
- Subscribe
- Mute
- Subscribe to RSS Feed
- Permalink
- Report Inappropriate Content
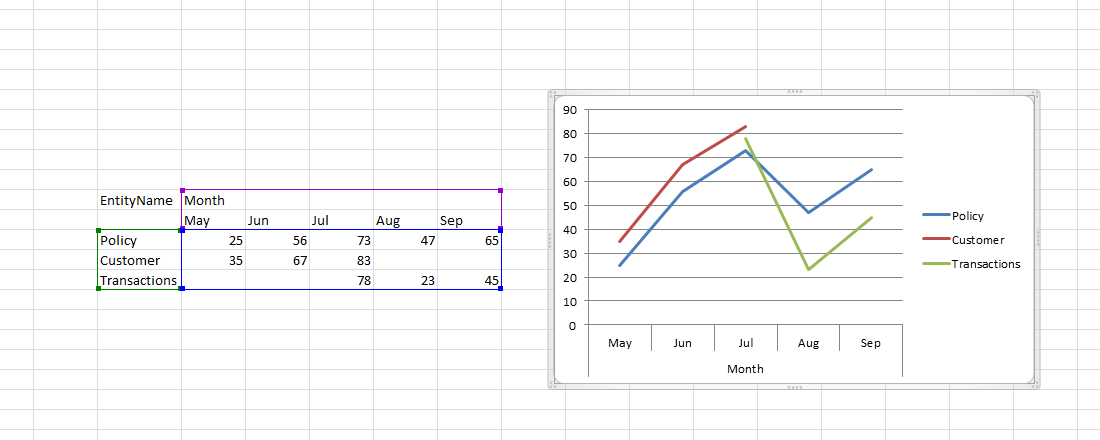
Siva, in its simplest form it should look similar - One Entity Name - and a monthly grouping of the Qualiy score ..
some may not have data present for some of the months ..
 this ..
- Mark as New
- Bookmark
- Subscribe
- Mute
- Subscribe to RSS Feed
- Permalink
- Report Inappropriate Content
Hi,
Is it what you want.
- Mark as New
- Bookmark
- Subscribe
- Mute
- Subscribe to RSS Feed
- Permalink
- Report Inappropriate Content
Cheers Garry , spot on