Unlock a world of possibilities! Login now and discover the exclusive benefits awaiting you.
- Qlik Community
- :
- All Forums
- :
- QlikView App Dev
- :
- Aggr Function
- Subscribe to RSS Feed
- Mark Topic as New
- Mark Topic as Read
- Float this Topic for Current User
- Bookmark
- Subscribe
- Mute
- Printer Friendly Page
- Mark as New
- Bookmark
- Subscribe
- Mute
- Subscribe to RSS Feed
- Permalink
- Report Inappropriate Content
Aggr Function
Hi,
I've been trying to get my hands on some reading material on the AGGR funciton. I have QV 8.5 which does not have much examples about the same. Would be really helpful if someone could upload a file, turorial etc explaining the same with examples
cheers
- Tags:
- new_to_qlikview
- « Previous Replies
-
- 1
- 2
- Next Replies »
Accepted Solutions
- Mark as New
- Bookmark
- Subscribe
- Mute
- Subscribe to RSS Feed
- Permalink
- Report Inappropriate Content
Think of the aggr() function as making a temporary table. For instance, let's say we have this real table of data:
Customer, Value
A, 20
A, 30
B, 10
B, 15
C, 40
Now, as a nonsense requirement, let's say that we're looking for maximum value by customer, and then the minimum of THAT value across customers. Our max value by customer is A=30, B=15, C=40. Our min of those is 15. Note how we built a temporary table with three rows while calculating it. Aggr() is one way to build this temporary table. Our dimension is Customer, and our expression is max(Value). We could build this as a real chart, but instead we want to use it in an expression without doing so. The general format for aggr() is this:
aggr(expression, dimensions)
So in our case:
aggr(max(Value),Customer)
We're trying to extract the minimum from that temporary table, that list of values, so we just enclose it in min():
min(aggr(max(Value),Customer))
- Mark as New
- Bookmark
- Subscribe
- Mute
- Subscribe to RSS Feed
- Permalink
- Report Inappropriate Content
Dear Umang you will get the same on the qlikview site itself , in training tab.
- Mark as New
- Bookmark
- Subscribe
- Mute
- Subscribe to RSS Feed
- Permalink
- Report Inappropriate Content
Hi Ashwin - hope Im not a bother biut could you tell me which training is that - or better send me a link or something
thanks
- Mark as New
- Bookmark
- Subscribe
- Mute
- Subscribe to RSS Feed
- Permalink
- Report Inappropriate Content
SIr, I am new at Qlik View. only 1 month exp
but I used to get most of help from the training from thik link hope it will help u after getting registered.
http://www.qlik.com/us/services/training/courses
also i will recomend you to install QV 9.0 or hierversion because very good help has been provided over there too ................
Regards
Ashwin
- Mark as New
- Bookmark
- Subscribe
- Mute
- Subscribe to RSS Feed
- Permalink
- Report Inappropriate Content
Think of the aggr() function as making a temporary table. For instance, let's say we have this real table of data:
Customer, Value
A, 20
A, 30
B, 10
B, 15
C, 40
Now, as a nonsense requirement, let's say that we're looking for maximum value by customer, and then the minimum of THAT value across customers. Our max value by customer is A=30, B=15, C=40. Our min of those is 15. Note how we built a temporary table with three rows while calculating it. Aggr() is one way to build this temporary table. Our dimension is Customer, and our expression is max(Value). We could build this as a real chart, but instead we want to use it in an expression without doing so. The general format for aggr() is this:
aggr(expression, dimensions)
So in our case:
aggr(max(Value),Customer)
We're trying to extract the minimum from that temporary table, that list of values, so we just enclose it in min():
min(aggr(max(Value),Customer))
- Mark as New
- Bookmark
- Subscribe
- Mute
- Subscribe to RSS Feed
- Permalink
- Report Inappropriate Content
Thanks for this very clear explanation!
- Mark as New
- Bookmark
- Subscribe
- Mute
- Subscribe to RSS Feed
- Permalink
- Report Inappropriate Content
John, thanks for this explanation, I can follow that.
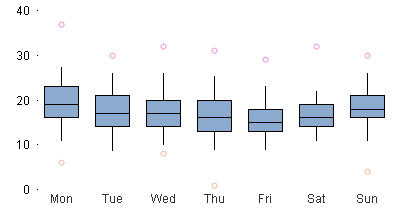
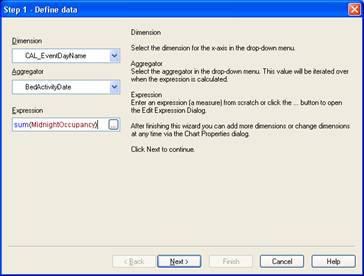
I've been using the box plot wizard which makes use of this function, but the wizard asks for a "dimension", an "aggregator" ? and an "expression". I can't figure out what the aggregator is for. When creating the box / wiskers qv then uses the function Aggr(expression,dimension,aggregator) in it's calculations. I can't find anything in the documentation about a 3rd parameter in Aggr? Can you help with a further explanation.
regards
Stewart
- Mark as New
- Bookmark
- Subscribe
- Mute
- Subscribe to RSS Feed
- Permalink
- Report Inappropriate Content
Good explanation on Aggr function. Thanks John
- Mark as New
- Bookmark
- Subscribe
- Mute
- Subscribe to RSS Feed
- Permalink
- Report Inappropriate Content
Hi.....
Imagine one custumer can have many invoices,an in case we want to know how many custumer have an invoice that are none than 120 days overdue.Also I want to group this by city ,so the only dimension I want to show is city.
In case Count(Distinct) will not work.In this case we have to use the aggregation function
Aggregation function are nothing but the temporary tables.
Syntax is aggr(expression,dimension)
as aggr(max(value),cstumer))
regards
Kamal
- Mark as New
- Bookmark
- Subscribe
- Mute
- Subscribe to RSS Feed
- Permalink
- Report Inappropriate Content
I think I understand your example. It is the box plot wizard I am finding hard to understand. It's a brilliant function that would take hours to do in other packages. I know the wizard works, but I'd just like to really understand what it is doing.
The wizard creates a number of expressions
eg the centre line of the box plot is created by expression
Fractile(Aggr(sum(MidnightOccupancy),[CAL_EventDayName],[BedActivityDate]), 0.5)
and the dimension variable of the chart is, as would be expected CAL_EventDayName.
In all the examples I have seen so far, Aggr only has 2 parameters , but the box plot uses the dimension variable as a third
Based on the examples, I would have thought that the expression should have just been Fractile(Aggr(sum(MidnightOccupancy),[BedActivityDate]), 0.5) with CAL_EventDayName being the dimension.
In the above example, I'm calculating the total occupancy of the hospital for every monday in the year, and then for the 52 mondays, finding the middle value….and doing that for each day in the week.
I think I understand what the 3 parameter aggr is doing (and why), but I struggle to put it into English. That makes it difficult for me to explain to anyone else.
Stewart
- « Previous Replies
-
- 1
- 2
- Next Replies »