Unlock a world of possibilities! Login now and discover the exclusive benefits awaiting you.
- Qlik Community
- :
- All Forums
- :
- QlikView App Dev
- :
- Re: Aggr, Max and Sum
- Subscribe to RSS Feed
- Mark Topic as New
- Mark Topic as Read
- Float this Topic for Current User
- Bookmark
- Subscribe
- Mute
- Printer Friendly Page
- Mark as New
- Bookmark
- Subscribe
- Mute
- Subscribe to RSS Feed
- Permalink
- Report Inappropriate Content
Aggr, Max and Sum
Dear Qlik colleagues,
File attached is calculating the total time of sales order flow inside company I work for.
We have average time and total time. The second gets the worst case on each department (Logistics, Sales-Comercial and Financial). But we desire to get the longer Sales Order (Pedido) instead of longer on each department.
For example: in out/2015 the longer case in Sales dept took 1174h56min and it was PEDIDO=102365. The longer case in Financial dept took 846h36min and it was PEDIDO=102663. The longer case in Logistics dept took 1448h05min and it was PEDIDO=102297.
But the question is: which was the longer PEDIDO in all 3 sectors (from beginning to end of flow)?
I already tried some formulas with Max, Aggr and Sum, but maybe it is not this way.
Does anyone have a solution?
Thanks and best regards,
Henrique
- « Previous Replies
-
- 1
- 2
- Next Replies »
- Mark as New
- Bookmark
- Subscribe
- Mute
- Subscribe to RSS Feed
- Permalink
- Report Inappropriate Content
Not yet, but I will check your proposal in a few minutes.
By the way, thanks for your quick reply.
- Mark as New
- Bookmark
- Subscribe
- Mute
- Subscribe to RSS Feed
- Permalink
- Report Inappropriate Content
Hi Sunny,
It is not exactly what I need. Your solution is returning total time in the department that took longest lead time.
Please, have a look at my answer to Andrey Khoronenko on 17/01/2017 11:21.
As you guys are returning suggestions to me, I think problem is getting clear.
Thanks for your help, once again.
Henrique
- Mark as New
- Bookmark
- Subscribe
- Mute
- Subscribe to RSS Feed
- Permalink
- Report Inappropriate Content
Folks,
With some of your suggestions the expression
=max(aggr(Sum({<Situação_Fluxo-={'11'}>} Tempo_total),PEDIDO))
is returning the number that I am looking for.
- Mark as New
- Bookmark
- Subscribe
- Mute
- Subscribe to RSS Feed
- Permalink
- Report Inappropriate Content
How about this?
=Sum(Aggr(If(PEDIDO = FirstSortedValue(TOTAL <$(='[' & GetCurrentField([Tempo]) & ']')> PEDIDO, -Aggr(Sum({<Situação_Fluxo-={'11'}>} Tempo_total), PEDIDO)), Sum({<Situação_Fluxo-={'11'}>} Tempo_total)), PEDIDO, $(='[' & GetCurrentField([Tempo]) & ']'), Setor))
- Mark as New
- Bookmark
- Subscribe
- Mute
- Subscribe to RSS Feed
- Permalink
- Report Inappropriate Content
Hi Henrique,
First, I created a variable varMaxVolume, which calculates the maximum total time of the sample (if the sample is not present, the maximum time is calculated from all the data). It contains the expression
=Max (Aggr(Sum(Tempo_total), PEDIDO))
Next, build a table with dimension PEDIDO and expressions
1) Comercial: Sum({<PEDIDO= {"=Num(Sum(Tempo_total))=varMaxVolume"}, Setor={'Comercial'}>} Tempo_total)
2) Financeiro: Sum({<PEDIDO= {"=Num(Sum(Tempo_total))=varMaxVolume"}, Setor={'Financeiro'}>} Tempo_total)
3) Logística: Sum({<PEDIDO= {"=Num(Sum(Tempo_total))=varMaxVolume"}, Setor={'Logística'}>} Tempo_total)
4) Grand Total: Num(Sum({<PEDIDO= {"=Num(Sum(Tempo_total))=varMaxVolume"}>}Tempo_total))
We get a table with a single line, with a maximum value of Grand Total in the sample or all data

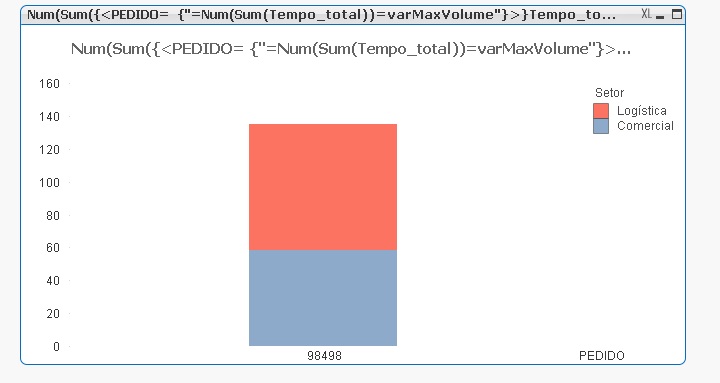
Now you can build a histogram. Dimensions PEDIDO and Setor, expression
Num(Sum({<PEDIDO= {"=Num(Sum(Tempo_total))=varMaxVolume"}>}Tempo_total))

Of course the parameters and settings of the histogram can be done in accordance with the tasks. Like this is what we were looking for. I am glad if I can be of any help to you.
Regards,
Andrey
- « Previous Replies
-
- 1
- 2
- Next Replies »