Unlock a world of possibilities! Login now and discover the exclusive benefits awaiting you.
- Qlik Community
- :
- All Forums
- :
- QlikView App Dev
- :
- Re: Re: Aggregate Function Help!
- Subscribe to RSS Feed
- Mark Topic as New
- Mark Topic as Read
- Float this Topic for Current User
- Bookmark
- Subscribe
- Mute
- Printer Friendly Page
- Mark as New
- Bookmark
- Subscribe
- Mute
- Subscribe to RSS Feed
- Permalink
- Report Inappropriate Content
Aggregate Function Help!
Hi,
I am having a problem with aggregate function which I thought I knew how it works but now I am just confused.
Scenario:
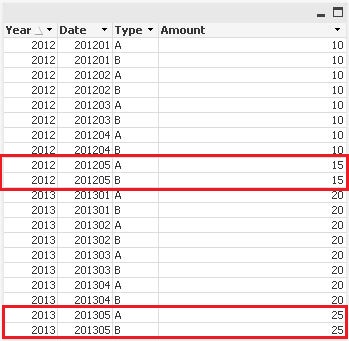
I have a set of data that looks like the image below, what I am trying to do now is to have a chart that shows the sum(Amount) of the last month of each year, therefore, the desired result should should be:
2012 : 30
2013 : 50
I have tried the expression below which I thought aggregate function should return me with the latest month of each year but it didn't give me the desired result but just empty cells  :
:
sum({<Date={"$(=aggr(max(Date),Year))"}>} Amount)
I have attached the test application that contain the data for this scenario, appreciate if anyone can help. Thank you.
Regards.
- Tags:
- aggregate
Accepted Solutions
- Mark as New
- Bookmark
- Subscribe
- Mute
- Subscribe to RSS Feed
- Permalink
- Report Inappropriate Content
- Mark as New
- Bookmark
- Subscribe
- Mute
- Subscribe to RSS Feed
- Permalink
- Report Inappropriate Content
Use:
=FirstSortedValue( AGGR(Sum(Amount),Date), -AGGR(Date,Date))
PFA
- Mark as New
- Bookmark
- Subscribe
- Mute
- Subscribe to RSS Feed
- Permalink
- Report Inappropriate Content
Hi,
see below scipt
hi see the below script,
tt:
LOAD year,
yearmonth,
amount
FROM
xyz.xls;
Left join
load
year,
max(yearmonth) as maxdates
resident tt group by year;
load
year,
if(yearmonth= maxdates,'y','n') as flag,
amount
resident tt;
drop Table tt;
now use =sum({<flag={'y'}>}amount) in your chart
anant
- Mark as New
- Bookmark
- Subscribe
- Mute
- Subscribe to RSS Feed
- Permalink
- Report Inappropriate Content
Hi ,
Create a variable
maxmnth=month(max(Date))
then the expression wud be
sum(if(month(Date)=maxmnth,Amount))..
See the attached file.
Cheers!!!
- Mark as New
- Bookmark
- Subscribe
- Mute
- Subscribe to RSS Feed
- Permalink
- Report Inappropriate Content
Thank you Tresesco, it solved my problem! 