Unlock a world of possibilities! Login now and discover the exclusive benefits awaiting you.
- Qlik Community
- :
- All Forums
- :
- QlikView App Dev
- :
- Re: Aggregating across dimensions with multiple cr...
- Subscribe to RSS Feed
- Mark Topic as New
- Mark Topic as Read
- Float this Topic for Current User
- Bookmark
- Subscribe
- Mute
- Printer Friendly Page
- Mark as New
- Bookmark
- Subscribe
- Mute
- Subscribe to RSS Feed
- Permalink
- Report Inappropriate Content
Aggregating across dimensions with multiple criteria
Please see attached. In cells EA, EB and EC, the correct denominator is shown in red. the denominator should be the number of accounts at age= 0 but for only those vintages that are active at a given age.
- Mark as New
- Bookmark
- Subscribe
- Mute
- Subscribe to RSS Feed
- Permalink
- Report Inappropriate Content
Thanks John. stalwar1 is the man!
- Mark as New
- Bookmark
- Subscribe
- Mute
- Subscribe to RSS Feed
- Permalink
- Report Inappropriate Content
If nothing is selected, this is what I see.

Is this right?
Would you be able to add another category so that we can work on that?
- Mark as New
- Bookmark
- Subscribe
- Mute
- Subscribe to RSS Feed
- Permalink
- Report Inappropriate Content
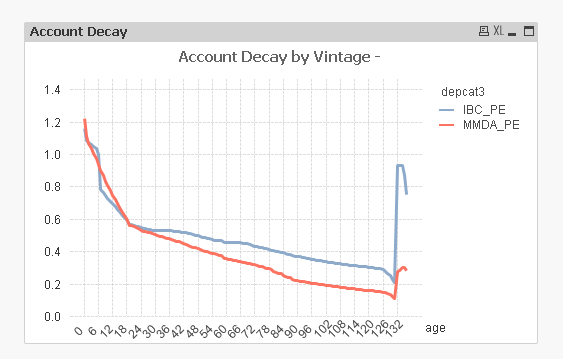
can't tell. Can you try selecting only vintages from 2001 onwards. That should give a declining curve, and then a spike and then again a consistent decline.
- Mark as New
- Bookmark
- Subscribe
- Mute
- Subscribe to RSS Feed
- Permalink
- Report Inappropriate Content
Here you go

I did attach the sample for your review. Attaching it again
- Mark as New
- Bookmark
- Subscribe
- Mute
- Subscribe to RSS Feed
- Permalink
- Report Inappropriate Content
stalwar1 can you see this file with added category? I can't tell whether the chart is showing the right values until I test it in SAS. Doing it now.
- Mark as New
- Bookmark
- Subscribe
- Mute
- Subscribe to RSS Feed
- Permalink
- Report Inappropriate Content
Can you repost the above document after adding the new field I proposed?
LOAD date(date#(file_date, 'DDMMMYYYY'),'MMM-YYYY') as file_Date,
AutoNumber(age, vintage_YYYYMM)-1 as Sort,
filedate_YYYYMM,
age,
vintage_YYYYMM,
tot_active_accts,
ECR_flag
FROM
(txt, codepage is 1252, embedded labels, delimiter is ',', msq)
where depcat3='IBC_PE';
- Mark as New
- Bookmark
- Subscribe
- Mute
- Subscribe to RSS Feed
- Permalink
- Report Inappropriate Content
stalwar1 Please see attached. Thanks for all your help.
- Mark as New
- Bookmark
- Subscribe
- Mute
- Subscribe to RSS Feed
- Permalink
- Report Inappropriate Content
May be this?
Sum(tot_active_accts)/Sum(Aggr(Above(Sum(tot_active_accts), Sort), (depcat3, (TEXT)), (vintage_YYYYMM, (NUMERIC)), (age, (NUMERIC))))
- Mark as New
- Bookmark
- Subscribe
- Mute
- Subscribe to RSS Feed
- Permalink
- Report Inappropriate Content
Almooostt! Why is it not showing anything now when I select just one vintage, like the chart below it which has vintage in the dimension?
Can't thank you enough.
- Mark as New
- Bookmark
- Subscribe
- Mute
- Subscribe to RSS Feed
- Permalink
- Report Inappropriate Content
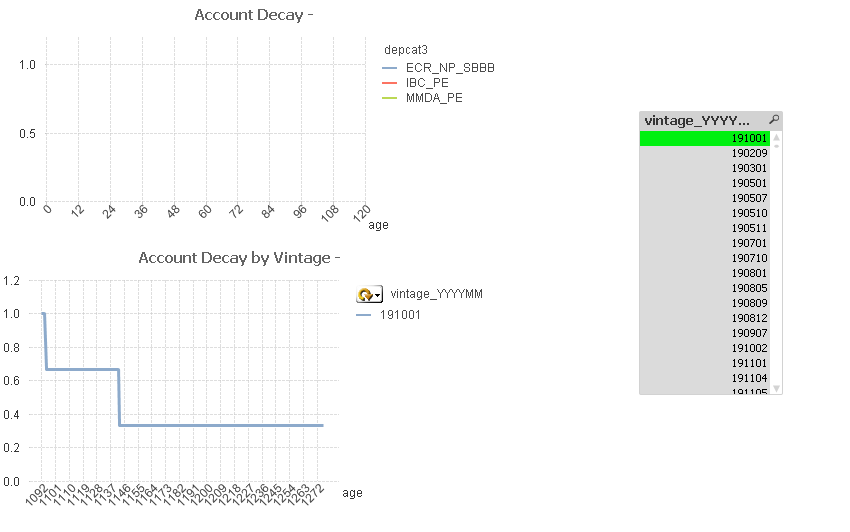
I am seeing this when I select 191001
