Unlock a world of possibilities! Login now and discover the exclusive benefits awaiting you.
- Qlik Community
- :
- All Forums
- :
- QlikView App Dev
- :
- Aggregation, RangeSum, Above
- Subscribe to RSS Feed
- Mark Topic as New
- Mark Topic as Read
- Float this Topic for Current User
- Bookmark
- Subscribe
- Mute
- Printer Friendly Page
- Mark as New
- Bookmark
- Subscribe
- Mute
- Subscribe to RSS Feed
- Permalink
- Report Inappropriate Content
Aggregation, RangeSum, Above
Hi,
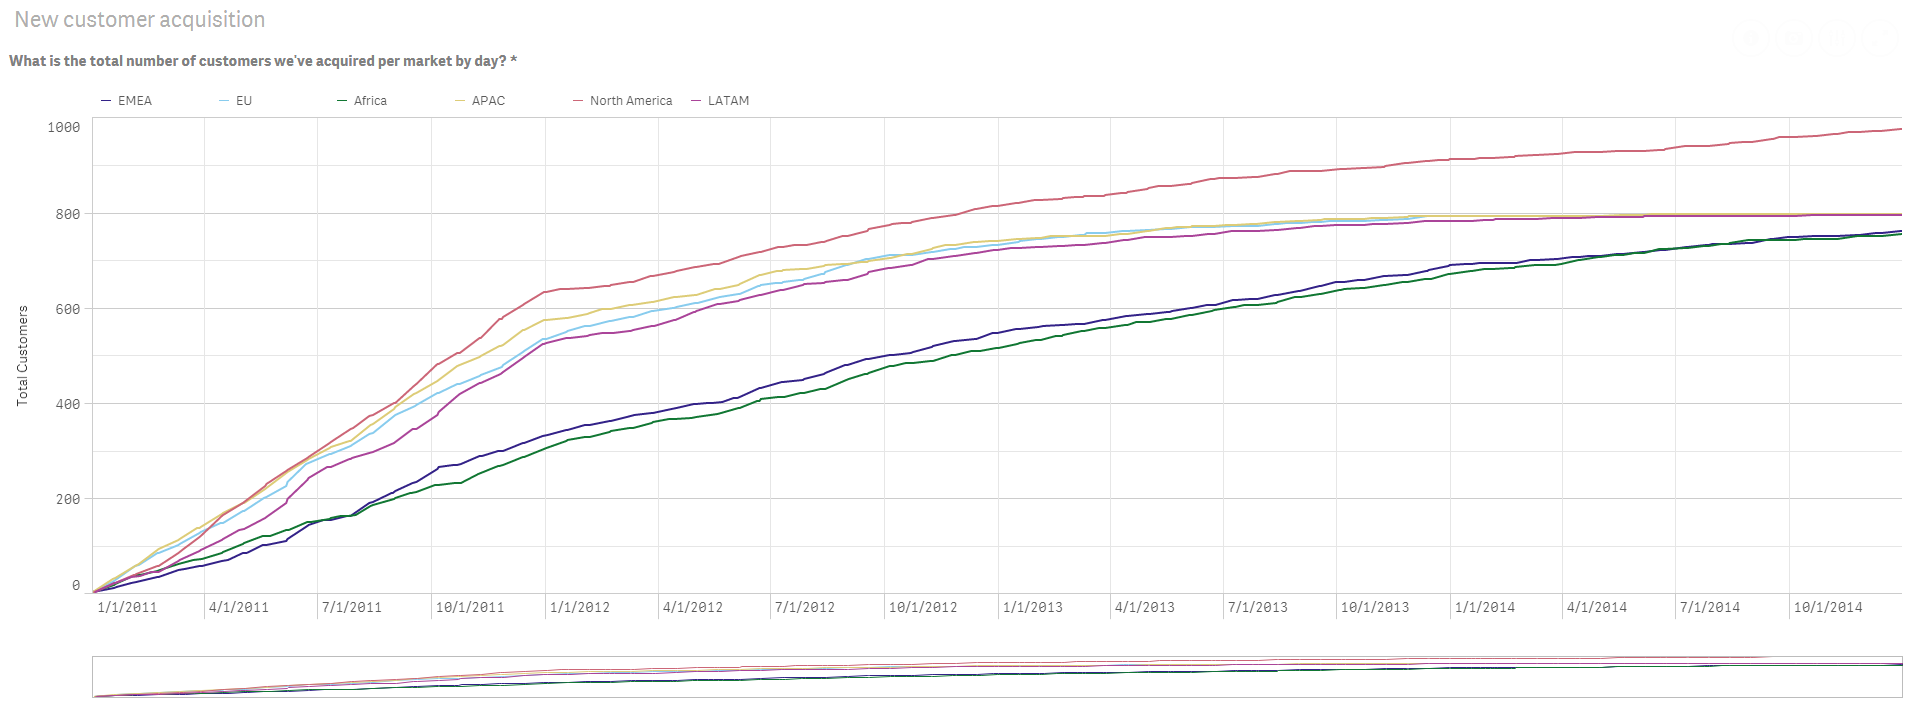
I'm using following formula to get a line chart that will represent accumulated count of new customer by order date.
Aggr(RangeSum(Above(Sum(Num([New or Existing])),0,RowNo())), [Customer Acquisition Market], [Order Date])
My count is off then the same example in Tableau post found at Top 15 Tableau LOD Expressions (Practical Examples) #5
I think my count is off because I'm not doing sum for only new customers.
Any guidance.
BR,
Vijay
Accepted Solutions
- Mark as New
- Bookmark
- Subscribe
- Mute
- Subscribe to RSS Feed
- Permalink
- Report Inappropriate Content
Why don't you Count the Customer ID instead of doing Sum(New or Existing)
Aggr(RangeSum(Above(Count(DISTINCT {<[New or Existing] = {">0"}>} [Customer ID]) + Sum({1} 0), 0, RowNo())), [Customer Acquisition Market], [Order Date])
I think it has to do with what petter-s has already mentioned in his post above
- Mark as New
- Bookmark
- Subscribe
- Mute
- Subscribe to RSS Feed
- Permalink
- Report Inappropriate Content
You calculate [New or Existing] as a flag in the load script for each and every order line item. So for some customers you get a single flag for a certain day but for others you get several flags. If the customer has two orders with 3 items on the first order and 5 items on the second order then this customer will have 8 [New or Existing] flags for that very day. Summing these flags will definitely lead to wrong numbers ....
You need to do the test whether [Customer Aquistion Date]=[Order Date] after you have aggregated up to the date level for each customer - then you can get a correct flag to sum og count. This you can do either in your load script or in a chart.
- Mark as New
- Bookmark
- Subscribe
- Mute
- Subscribe to RSS Feed
- Permalink
- Report Inappropriate Content
Why don't you Count the Customer ID instead of doing Sum(New or Existing)
Aggr(RangeSum(Above(Count(DISTINCT {<[New or Existing] = {">0"}>} [Customer ID]) + Sum({1} 0), 0, RowNo())), [Customer Acquisition Market], [Order Date])
I think it has to do with what petter-s has already mentioned in his post above
- Mark as New
- Bookmark
- Subscribe
- Mute
- Subscribe to RSS Feed
- Permalink
- Report Inappropriate Content
Hi Petter,
I'm thankful for your response. It did provide me the insight on what I had to correct. I was still struggling with coming up the formula in the chart, which Sunny has resolved.
I do appreciate your help.
Thanks & Regards,
Vijay
- Mark as New
- Bookmark
- Subscribe
- Mute
- Subscribe to RSS Feed
- Permalink
- Report Inappropriate Content
Hi Sunny,
Me and my team are planning to provide a demo on how to do TableauLoD using Qlik Sense to our internal Qlik and business users.
If you would help me understand the formula in simple language will be very helpful.
I'm trying to understand what you have done in the formula. I did wanted to use Customer Id but was struggling to get right syntax for distinct and other pieces that were needed in the formula.
Best Regards,
Vijay
- Mark as New
- Bookmark
- Subscribe
- Mute
- Subscribe to RSS Feed
- Permalink
- Report Inappropriate Content
Sure...Breaking into pieces
Count(DISTINCT {<[New or Existing] = {">0"}>} [Customer ID])
Count of distinct customers where [New or Existing] is not 0 (because Existing = 0).
Sum({1} 0) is used because there are some missing entries based on the set analysis condition... so the chart was breaking... I just added 0 to make the line continuous.
Do you need to understand what RangeSum(Above()) is used for?
- Mark as New
- Bookmark
- Subscribe
- Mute
- Subscribe to RSS Feed
- Permalink
- Report Inappropriate Content
Hi Sunny,
That is definitely helpful in understanding. I do understand RangeSum(Above()) but please let me understand from your prespective and I think it will be useful for others reviewing this post.
Can you please also explain little bit on why count on customer and not sum on new/existing.
Thanks & Regards,
Vijay
- Mark as New
- Bookmark
- Subscribe
- Mute
- Subscribe to RSS Feed
- Permalink
- Report Inappropriate Content
That is definitely helpful in understanding. I do understand RangeSum(Above()) but please let me understand from your prespective and I think it will be useful for others reviewing this post.
RangeSum(Above()) is used for cumulative sum. This can also be achieved using the The As-Of Table and I consider it to be a better option...but a lot of the time developers don't have access to the script, or don't want to touch the complicated scripts in which case a less efficient way of doing accumulation is using RangeSum(Above()) function (Calculating rolling n-period totals, averages or other aggregations)
Can you please also explain little bit on why count on customer and not sum on new/existing.
I didn't do my own research on this, but what Petter mentioned above made sense that there might multiple items on there 1st order...
For example
Customer ID Date [Customer Aquistion Date] Order Item New or Existing
ABC 01/20/2018 01/20/2018 123 1 1
ABC 01/20/2018 01/20/2018 123 2 1
ABC 01/20/2018 01/20/2018 123 3 1
ABC 03/30/2018 01/20/2018 234 1 0
ABC 04/21/2018 01/20/2018 345 1 0
Now if you do Sum(New or Existing), it will be 3... but do we really have 3 new customers? No, the customer is only 1... but his 1st order included 3 items.... So, Distinct count of customer where New or Existing <> 0 or New or Existing = 1 will give 1 which is the right number, right?
- Mark as New
- Bookmark
- Subscribe
- Mute
- Subscribe to RSS Feed
- Permalink
- Report Inappropriate Content
Hi Sunny,
Why chart renders zigzag instead of continuous line when I reload it or try to add a calculated dimension in the script which results in same number of rows in the table.
Best regards,
Vijay
- Mark as New
- Bookmark
- Subscribe
- Mute
- Subscribe to RSS Feed
- Permalink
- Report Inappropriate Content
Hi Sunny,
I implemented AsofDate and it is much easier to get chart working. I've included it here for reference. I still had challenge getting smooth line after reloading or adding additional data points.
Best Regards,
Vijay