Unlock a world of possibilities! Login now and discover the exclusive benefits awaiting you.
- Qlik Community
- :
- All Forums
- :
- QlikView App Dev
- :
- Aggregation of two different aggregation fields
- Subscribe to RSS Feed
- Mark Topic as New
- Mark Topic as Read
- Float this Topic for Current User
- Bookmark
- Subscribe
- Mute
- Printer Friendly Page
- Mark as New
- Bookmark
- Subscribe
- Mute
- Subscribe to RSS Feed
- Permalink
- Report Inappropriate Content
Aggregation of two different aggregation fields
Dear all,
I am trying to do an aggregate of two formulas:
=Avg(Aggr(NODISTINCT Count( Ean)
/
Count( {<Manufacturer>}DISTINCT Ean), Store))
When I see the data ordered by manufacturer I see it in the incorrectly following way
| Manufacturer | Data |
| A | 28,4399% |
| B | 28,4399% |
| C | 30,3295% |
| D | 28,4399% |
| E | 28,1219% |
| F | 28,3337% |
However, when I select the manufacturer A I see the correct data that I would have for Manufacturer A in the previous chart. It seems to be a problem in the numerator.
| Manufacturer | Data |
| A | 8,9199% |
If I split the formula with two aggregates and add to the numerator the aggregation of the manufacturer it gives the correct number:
=Avg(Aggr(NODISTINCT Count( Ean)
, Manufacturer, Store))
but how can I aggregate two formulas with different aggregations?
Thank you.
Best regards.
- Mark as New
- Bookmark
- Subscribe
- Mute
- Subscribe to RSS Feed
- Permalink
- Report Inappropriate Content
can you please provide sample data or sample apps?
- Mark as New
- Bookmark
- Subscribe
- Mute
- Subscribe to RSS Feed
- Permalink
- Report Inappropriate Content
Dear Manish,
I am very sorry but I can not provide more sample data or sample apps.
What I want to do is a share through an average of
Count( Ean /
Count( {<Manufacturer>}DISTINCT Ean)
The thing is that I want to do this process line by line, so I do a AGGR and an average previously.
I am aggregating by Store, so it gives the same data for the different manufacturers in the numerator and other same figure for the denominator of the manufacturers.
The numerator should also be aggregated by manufacturer, but in a same aggregation I can't insert the manufacturer because the denominator shouldn't be affected by the manufacturer...
So when I select just a manufacturer the data displayed is ok, but when I do not select any manufacturer, or just a couple of thems, the data displayed is not the correct one for that manufacturer...
Thank you.
Best regards.
- Mark as New
- Bookmark
- Subscribe
- Mute
- Subscribe to RSS Feed
- Permalink
- Report Inappropriate Content
Finally, I made to upload the document.
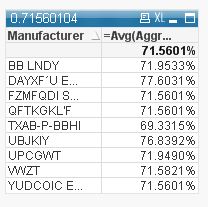
I have the following table when selecting a subcategory LXNKME
| Manufacturer | Data |
| BB LNDY | 71,9533% |
| DAYXF´U EMYZUTOXY | 77,6031% |
| FZMFQDI SRCKN | 71,5601% |
| QFTKGKL'F | 71,5601% |
| TXAB-P-BBHI | 69,3315% |
| UBJKIY | 76,8392% |
| UPCGWT | 71,9490% |
| VWZT | 71,5821% |
| YUDCOIC EZKVZ | 71,5601% |
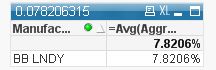
The thing is that these figures are not OK, and for BB LNDY should be:
| Manufacturer | Data |
| BB LNDY | 7,8206% |
When selecting just one manufacturer it is okay, but when seeing all of them together, the figures are nor alright.
Any idea?
Thank you.
Best regards.
- Mark as New
- Bookmark
- Subscribe
- Mute
- Subscribe to RSS Feed
- Permalink
- Report Inappropriate Content
Can you please provide the logic behind your requested result? i.e. what you want to get ?
Thanks
- Mark as New
- Bookmark
- Subscribe
- Mute
- Subscribe to RSS Feed
- Permalink
- Report Inappropriate Content
Dear Manisch,
I want to have a share of SKUs. However, I cannot do the division between the EAN and the total EANs, because I want to do this line by line, and not as a total, that is the way qlikview calculates the data.
Therefore, I do the division aggregating by shop. However, the numerator should also be aggregated by manufacturer in this case.
In the uploaded qlikview, you can see the following data if no manufacturer is selected.
However, I don't want to see for BB LNDY (and the same happens for the rest of the manufacturers) an 71,95%, because the numerator is from all the manufacturers.
I want to see for BB LNDY the 7,82 that appears when I select just the manufacturer BB LNDY
How can I get this 7,82% for BB LNDY when I am not selecting any Manufacturer?
Thank you.
Best regards.