Unlock a world of possibilities! Login now and discover the exclusive benefits awaiting you.
- Qlik Community
- :
- All Forums
- :
- QlikView App Dev
- :
- Aggregation to get the rank?
- Subscribe to RSS Feed
- Mark Topic as New
- Mark Topic as Read
- Float this Topic for Current User
- Bookmark
- Subscribe
- Mute
- Printer Friendly Page
- Mark as New
- Bookmark
- Subscribe
- Mute
- Subscribe to RSS Feed
- Permalink
- Report Inappropriate Content
Aggregation to get the rank?
Hello,
I have the following data:
Data:
LOAD * INLINE [
Shop, Group, Product, Sells
Darty, Clothes, Socks, 0
Darty, Clothes, Shirts, 0
Darty, Hi-Fi, TV, 100
Darty, Hi-Fi, Camera, 200
Carrefour, Clothes, Socks, 100
Carrefour, Clothes, Shirts, 100
Carrefour, Hi-Fi, TV, 5
Carrefour, Hi-Fi, Camera, 10
Auchan, Clothes, Socks, 200
];
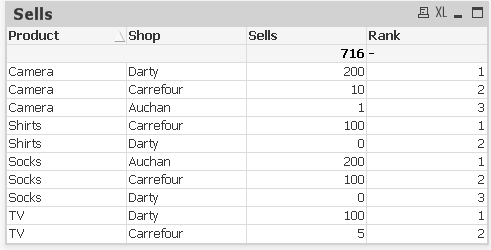
If I look for each Product, I can make a rank of the sells by Shop:

Now, what I want is the following thing:
- I select a Shop
- I have a chart (straight table) that make a list of each Product and says "for this product, the selected Shop is ranked X".
Example:
- I select "Carrefour"
-->
Camera : 2
Shirts : 1
Socks : 2
TV : 2
- I select "Auchan"
-->
Camera : 3
Socks : 1
I've played with aggr distinct / nodictinct, rank, total, separated dimensions, ... but without success.
It may be simple but my brain is gone too far.
Do you have any idea of how I could get my chart?
ps : I don't want to pre-calculate the rank in my script, beacause I have many others fields as selections.
- Mark as New
- Bookmark
- Subscribe
- Mute
- Subscribe to RSS Feed
- Permalink
- Report Inappropriate Content
I've done the trick by counting how many "Shop" have a better "sum(Sells)".
count({$ <Shop=>} distinct if(aggr(nodistinct sum({$ <Shop=>} Sells), Shop, Product) >= aggr(nodistinct sum({$ <Shop=P(DimShop)>} Sells), Product), Shop))