Unlock a world of possibilities! Login now and discover the exclusive benefits awaiting you.
- Qlik Community
- :
- All Forums
- :
- QlikView App Dev
- :
- Alternate States - Show data in table based on sel...
- Subscribe to RSS Feed
- Mark Topic as New
- Mark Topic as Read
- Float this Topic for Current User
- Bookmark
- Subscribe
- Mute
- Printer Friendly Page
- Mark as New
- Bookmark
- Subscribe
- Mute
- Subscribe to RSS Feed
- Permalink
- Report Inappropriate Content
Alternate States - Show data in table based on selections in List Box
Hi,
I am quite new to using qlikview, so any help would be great!
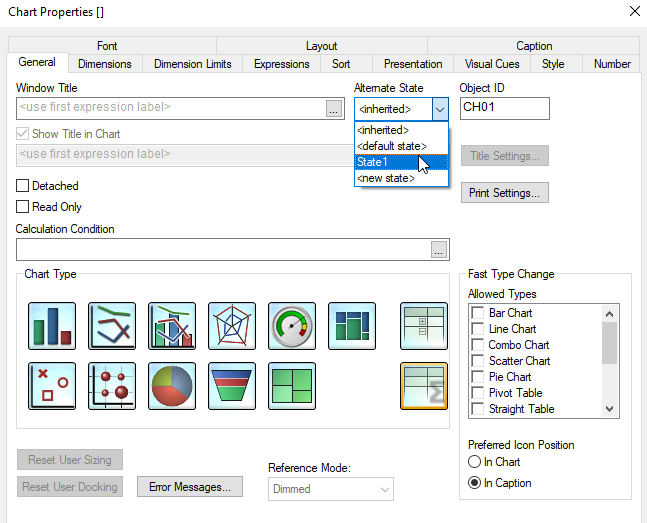
Objective: Populate a straight table based on the selections made in a list box by assigning both List box object and the chart object to one single Alternate State.
Alternate State name: State1
List Box holds a list of dates. Field name used in the list box is 'Date'
Straight Table should show the selected dates (in list box) as dimension and should get listed in the 'Date' column of the table shown below.
What I want to do: make the Date field (in the table as a dimension) = to the selected values from the list box and then show them in the table so the corresponding E1, E2, E3, and E4 columns can be populated. What would be the expression logic to use for the dimension so I can use the alternate state name both objects are assigned to? Right now I something like this: =Date=State1::Date --> this is not correct at the moment.
Here is what I have: list box of dates (attached image ListBox)
Table to be populated:
| Date | E1 | E2 | E3 | E4 |
|---|---|---|---|---|
| 7/2/2018 | ||||
| 7/3/2018 |
- Mark as New
- Bookmark
- Subscribe
- Mute
- Subscribe to RSS Feed
- Permalink
- Report Inappropriate Content
I think I do not understand your issue.
If you have assigned both sheet objects to the same alternate states, the straight table should already reflect the selections in your list box, no need to specify the state in the dimension or expression then (this is needed if you want to mix states in the results of your chart, i.e. show results based on different states, using set analysis with a different syntax then you tried).
Just to check, have you set the alternate state in both objects (also in general tab of your straight table properties)?

- Mark as New
- Bookmark
- Subscribe
- Mute
- Subscribe to RSS Feed
- Permalink
- Report Inappropriate Content
Hi Stefan, thanks for your reply. I forgot to mention another detail of my current setup.
I have another calendar object in the same sheet that is used to control another table that I have set up. I have setup the calendar object to another state called "State 2" and the second table is also set to "State 2". The problem is this calendar object set to "State 2" is also controlling the table that is set to "State 1". I am not sure why this is happening.
Problem 2: When calendar object has a range of dates, for ex: 7-1-2018 to 7-31-2018 and when I select a date within that range in the list box, data shows in table set to "State 1" for that particular date. With the same range of dates in the calendar object, I select date 8-1-2018 in the list box, but data for 8-1-2018 does not show in table set to "state 1". I don't understand why this is the case as well.
What I want is the list box to not be dependent on the calendar object. I don't want table set to "State 1" to show any values in it unless a date value is selected in the list box.
It might be too broad of a question, so maybe you have another idea I can use to achieve my goal. Thanks for your help!
- Mark as New
- Bookmark
- Subscribe
- Mute
- Subscribe to RSS Feed
- Permalink
- Report Inappropriate Content
Well, State 1 and 2 should be independent and that's what you want, right?
Currently, it seems that State 2 is somehow influencing State 1 or at least the chart connected to State 1. There are some places one can set up such behaviour, two that come to my mind at the moment:
a) Triggers
Check that no triggers are set that may change your state 1 field selections based on other selections in other fields.
Check Settings - Document Properties - Triggers - Field Event triggers first
b) Set Analysis in your chart
Check that there is no mix between states in a set expression in your chart aggregations (Check if set expressions are used in calculated dimensions or expressions, it's the part in curly brackets in a aggregation function, like Sum {SetExpression} FIELD)
Maybe there are other things to check. Could you upload your sample application?