Unlock a world of possibilities! Login now and discover the exclusive benefits awaiting you.
- Qlik Community
- :
- All Forums
- :
- QlikView App Dev
- :
- Re: Animated Chart (I think) query
- Subscribe to RSS Feed
- Mark Topic as New
- Mark Topic as Read
- Float this Topic for Current User
- Bookmark
- Subscribe
- Mute
- Printer Friendly Page
- Mark as New
- Bookmark
- Subscribe
- Mute
- Subscribe to RSS Feed
- Permalink
- Report Inappropriate Content
Animated Chart (I think) query
First of all apologies I havent actually attempted this yet as ive just had a great idea and have too little time to spend discovering how to best to achieve it.
I have traffic data (e.g speed, length, time of day, location etc) and my idea is to basically draw a road in the window with have graphs at certain spots in the window that relate to site specific data. i can then apply filters to either look at specific times in the day or average over the lot. my idea was wouldnt it be great if the charts could be animated/looped to show progression through the day, an obvious must is that they have to be synced.
im assuming this is possible and hopefully not too time consuming as I will have about an hour to complete this prior to demonstration. other wise im stuck with the same old boring graphs.
thanks ahead of any help its greatly appreciated!
- Tags:
- new_to_qlikview
Accepted Solutions
- Mark as New
- Bookmark
- Subscribe
- Mute
- Subscribe to RSS Feed
- Permalink
- Report Inappropriate Content
Hi Samuel,
Yes, this can be done, but you will not do it in an hour
Regards
Alan
- Mark as New
- Bookmark
- Subscribe
- Mute
- Subscribe to RSS Feed
- Permalink
- Report Inappropriate Content
Hi Samuel,
Yes, this can be done, but you will not do it in an hour
Regards
Alan
- Mark as New
- Bookmark
- Subscribe
- Mute
- Subscribe to RSS Feed
- Permalink
- Report Inappropriate Content
thats unfortunate,
thanks for the speedy reply
- Mark as New
- Bookmark
- Subscribe
- Mute
- Subscribe to RSS Feed
- Permalink
- Report Inappropriate Content
In place of list box if you use calender object will give you good presentation for the chart.
- Mark as New
- Bookmark
- Subscribe
- Mute
- Subscribe to RSS Feed
- Permalink
- Report Inappropriate Content
Many chart types have an Animation setting that can be activated. Basically you would animate it over the time dimension in this case. It will add a play button to the chart, and can be set to loop. It does have some limitations though, for example I don't think it will work in the full browser client.
- Mark as New
- Bookmark
- Subscribe
- Mute
- Subscribe to RSS Feed
- Permalink
- Report Inappropriate Content
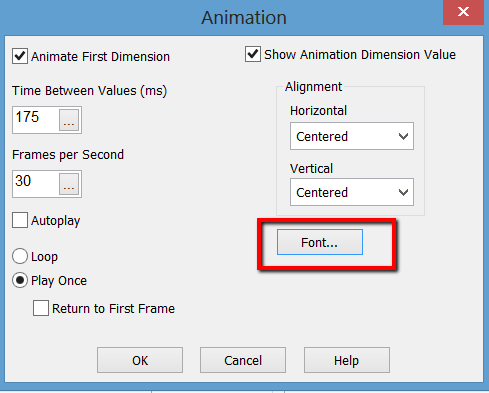
thanks guys, ive actually managed to get one working, ive obviously animated the time dimension but is there a way to show the time that is currenlty being viewed? ive clicked the show animated value button but it hasnt really made a difference, is this becuase it will be animating too fast for the eye to register the changes so sees no need in showing?
- Mark as New
- Bookmark
- Subscribe
- Mute
- Subscribe to RSS Feed
- Permalink
- Report Inappropriate Content
Hi Samuel,
Change the font and color of it
- Mark as New
- Bookmark
- Subscribe
- Mute
- Subscribe to RSS Feed
- Permalink
- Report Inappropriate Content
thanks but ive sussed it, youll laugh but the time between values was 1000ms and my data has 1 second increments so I just assumed it was the timer on the chart not the value lol,
if i make several of these graphs with the follwing expression where the xx defines the location is there a way to sync the animations so they all show the same time?
avg({$< [Geographic Address] = {'xxxx'}>} [Speed(Lane 1)])
- Mark as New
- Bookmark
- Subscribe
- Mute
- Subscribe to RSS Feed
- Permalink
- Report Inappropriate Content
Samuel,
It would be easier if you could share the App