Unlock a world of possibilities! Login now and discover the exclusive benefits awaiting you.
- Qlik Community
- :
- All Forums
- :
- QlikView App Dev
- :
- Aplication is displaying worng values
- Subscribe to RSS Feed
- Mark Topic as New
- Mark Topic as Read
- Float this Topic for Current User
- Bookmark
- Subscribe
- Mute
- Printer Friendly Page
- Mark as New
- Bookmark
- Subscribe
- Mute
- Subscribe to RSS Feed
- Permalink
- Report Inappropriate Content
Aplication is displaying worng values
Hi All,
I am facing some wieard problem in my application,
- « Previous Replies
-
- 1
- 2
- Next Replies »
- Mark as New
- Bookmark
- Subscribe
- Mute
- Subscribe to RSS Feed
- Permalink
- Report Inappropriate Content
Hi,
Care to elaborate more?
- Mark as New
- Bookmark
- Subscribe
- Mute
- Subscribe to RSS Feed
- Permalink
- Report Inappropriate Content
Hi All,
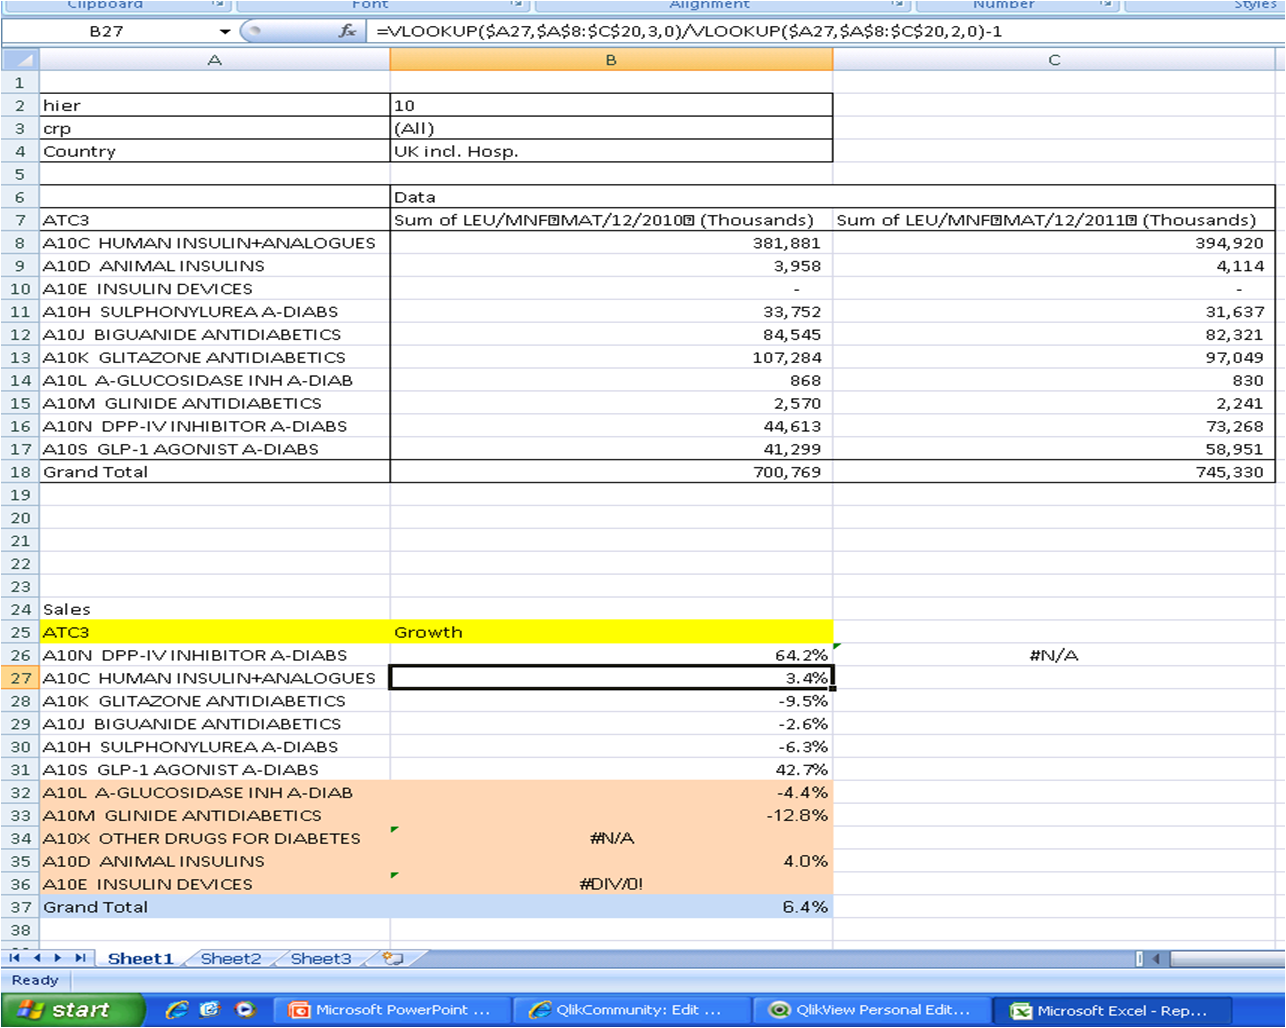
I am facing some wieard problem in my application, i have attachecd both my application and the pic of excel (only for one country as i cant give the whole file) in the application the table values are incorrect when compared to excel, can any one let me know why is this happening, where i am doing wrong,
- Mark as New
- Bookmark
- Subscribe
- Mute
- Subscribe to RSS Feed
- Permalink
- Report Inappropriate Content
Any Help will be appreciated, its a bit urgent becoz there are around 35 chart and in all its taking wrong values, jst 2 day's back whn i have created it, all the values were correct, but whn i opened the file now the values got changes and few of the values in table and chart are wrong, can any one let me know why is it happening,
- Mark as New
- Bookmark
- Subscribe
- Mute
- Subscribe to RSS Feed
- Permalink
- Report Inappropriate Content
Hi, I see all values matching. I need you to do the following. Your sample application is very messy. DELETE everything, and put just a table with what you need to compare and tell us exacatly what to compare it in your excel file (highlight in your excel what we need to be looking at)
- Mark as New
- Bookmark
- Subscribe
- Mute
- Subscribe to RSS Feed
- Permalink
- Report Inappropriate Content
hi,
As you see in my application the MAT'10 and MAT'11 values which are highlited in red in the pic is not matching, but the percentage is comming correct, i just want to display the correct values,

- Mark as New
- Bookmark
- Subscribe
- Mute
- Subscribe to RSS Feed
- Permalink
- Report Inappropriate Content
Sorry cant able to upload the new report, the net is showing error, you can check in the original application 2nd table from top
- Mark as New
- Bookmark
- Subscribe
- Mute
- Subscribe to RSS Feed
- Permalink
- Report Inappropriate Content
any help any one
- Mark as New
- Bookmark
- Subscribe
- Mute
- Subscribe to RSS Feed
- Permalink
- Report Inappropriate Content
You need to start verifying from the details first, not the sums. Start by finding one data row in your excel-sheet and match the exact row in QlikView. Are you sure you are reading the correct version of the excelfile? Also try first to read it without crosstable just for verification, then add crosstable and verify. This way you will find which step fails.
If all details are correct, but the sums fail then start looking for duplicates or missing rows. Your sample script and application is too complex to debug with having access to the full data.
Olof Laurin, Senior Consultant at Tacticus AB, http://www.tacticus.se
- Mark as New
- Bookmark
- Subscribe
- Mute
- Subscribe to RSS Feed
- Permalink
- Report Inappropriate Content
Hi Laurin,
Yes i am using the correct version of excelfile, i have crossed check the values both in excel and application there the application is taking some extra values, and when i readit without crosstable the values came correct but i have to use cross table i am not able to create chart with individual values, can u suggest any idea
- « Previous Replies
-
- 1
- 2
- Next Replies »