Unlock a world of possibilities! Login now and discover the exclusive benefits awaiting you.
- Qlik Community
- :
- All Forums
- :
- QlikView App Dev
- :
- Association
- Subscribe to RSS Feed
- Mark Topic as New
- Mark Topic as Read
- Float this Topic for Current User
- Bookmark
- Subscribe
- Mute
- Printer Friendly Page
- Mark as New
- Bookmark
- Subscribe
- Mute
- Subscribe to RSS Feed
- Permalink
- Report Inappropriate Content
Association
Hi ALL,
I am using Text box to display the numbers ..i have total counts of ID's 300
and i have divided into 3types ..
High low and neutral
Now i get 3 diffreent text Object which displays different vales for High, Low and Neutral
below this iam using a starigth table which will give me the detailed information and this is working fine ..
but the problem is when i click on any of the Text object ( high, Low, Neutral ) the table chart will not filter the value ...How do i achive this ..
If i slect either of the text box then tha table chart should display me the detailed information about those ID which are either High, Low or Neutral
Iam using this expression with test Object
High
=count({<Category={'High'}>}ID)
Low
=count({<Category={'Low'}>}ID)
Neutral
=count({<Category={'Neutral'}>}ID)
do i need to alter in the explression ?
Thanks in Advance
- Mark as New
- Bookmark
- Subscribe
- Mute
- Subscribe to RSS Feed
- Permalink
- Report Inappropriate Content
Hi John,
Solution 1:-
Give a List box for High, Low, Neutral.it will resolve your issue.
Solution 2:-
create 3 variables for High, Low, Neutral
and create 3 Straight tables for High, Low, Neutral ,in the LAYOUT tab under show / condition of each table you need to write conditional show if(vhigh=1,1,0)...etc.
and create 1 more straight table with conditional show (vhigh and vlow, and nauteral are zero0)
so it will show all are failed.
Solution 3 :
create 4 straight tables (High, Low, Neutral ,Default one) and put them into container object.
- Mark as New
- Bookmark
- Subscribe
- Mute
- Subscribe to RSS Feed
- Permalink
- Report Inappropriate Content
Hello John,
You can create a variable to capture click for each category by adding an action (set variable) and different expression for every category will be enabled based on latest click.
Please refer sample application attached herewith.
Hope this will be helpful.
Regards!
Rahul Pawar
- Mark as New
- Bookmark
- Subscribe
- Mute
- Subscribe to RSS Feed
- Permalink
- Report Inappropriate Content
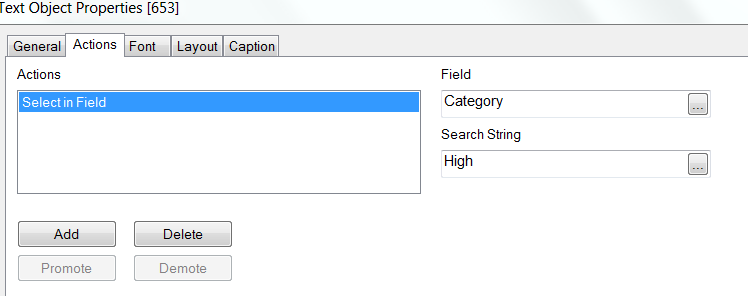
Hi John,
you could also add an Action in every textobject.
Action Select In Field, like this for High