Unlock a world of possibilities! Login now and discover the exclusive benefits awaiting you.
- Qlik Community
- :
- All Forums
- :
- QlikView App Dev
- :
- Average (Sum of Average) in a Pivot Table
- Subscribe to RSS Feed
- Mark Topic as New
- Mark Topic as Read
- Float this Topic for Current User
- Bookmark
- Subscribe
- Mute
- Printer Friendly Page
- Mark as New
- Bookmark
- Subscribe
- Mute
- Subscribe to RSS Feed
- Permalink
- Report Inappropriate Content
Average (Sum of Average) in a Pivot Table
Hi All,
I need help on the problem below. Hope someone can help to enlighten me on this. Thanks!
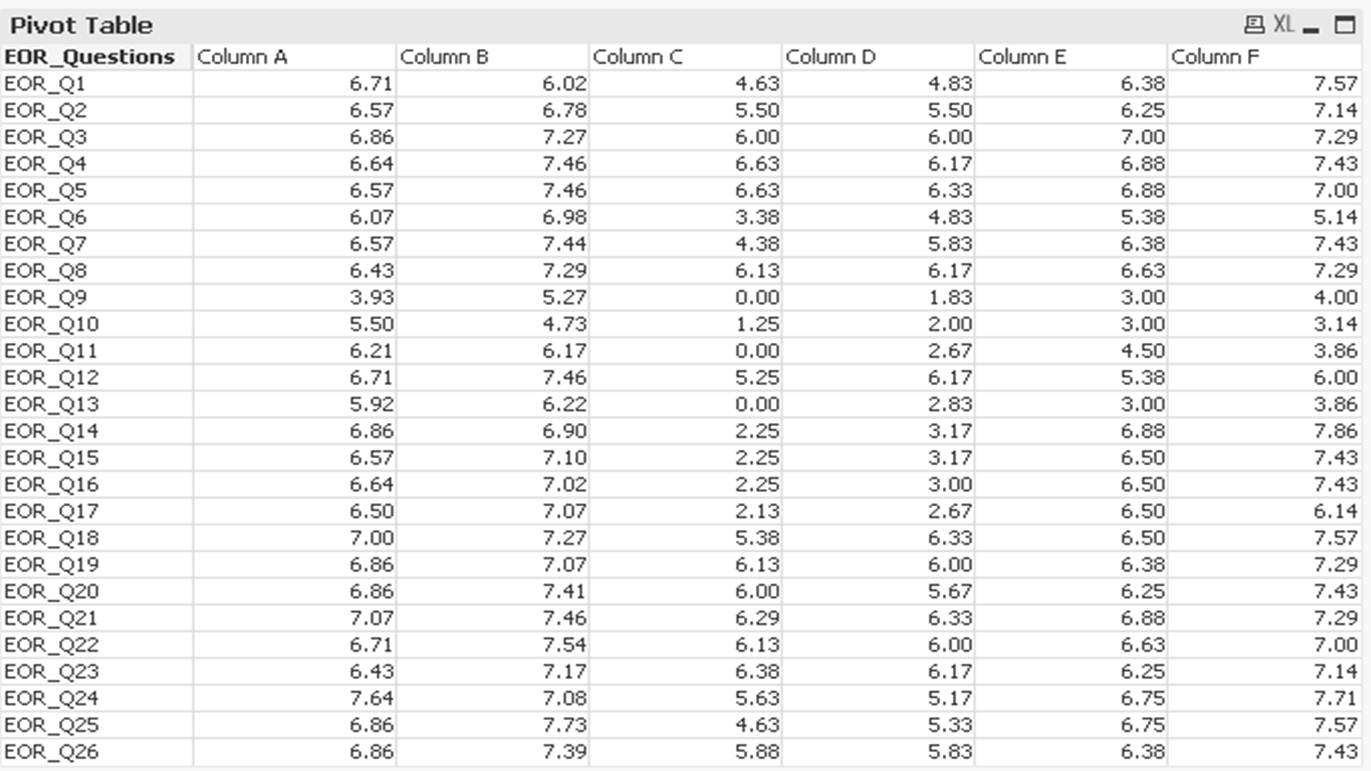
Above is a pivot table.
Each value in the table is an average for each question. This is done by an expression.
I am trying to create a new Average Total at the bottom of the table where all the values in column A is sum and divided by the number of rows.
Would appreciate if some one can help on this. Thanks!
- « Previous Replies
-
- 1
- 2
- Next Replies »
Accepted Solutions
- Mark as New
- Bookmark
- Subscribe
- Mute
- Subscribe to RSS Feed
- Permalink
- Report Inappropriate Content
Hi,
Why you are using "1" in your set analysis? Is that because you want to always show all the lines?
Please try with this expression:
AVG(AGGR(AVG({$<EOR_Subject_Name = {[Subject_A]}>}Data),EOR_Subject_Name,EOR_Questions))
What's the result you get with the above expression?
Cesar
- Mark as New
- Bookmark
- Subscribe
- Mute
- Subscribe to RSS Feed
- Permalink
- Report Inappropriate Content
Steps :-
Create Variable Var1 = Count(Column A) Will holds the count
= Sum( TOTAL ( Column(A) ) ) / Var1
Hope this helps you.
Vikas
If the issue is solved please mark the answer with Accept as Solution & like it.
If you want to go quickly, go alone. If you want to go far, go together.
- Mark as New
- Bookmark
- Subscribe
- Mute
- Subscribe to RSS Feed
- Permalink
- Report Inappropriate Content
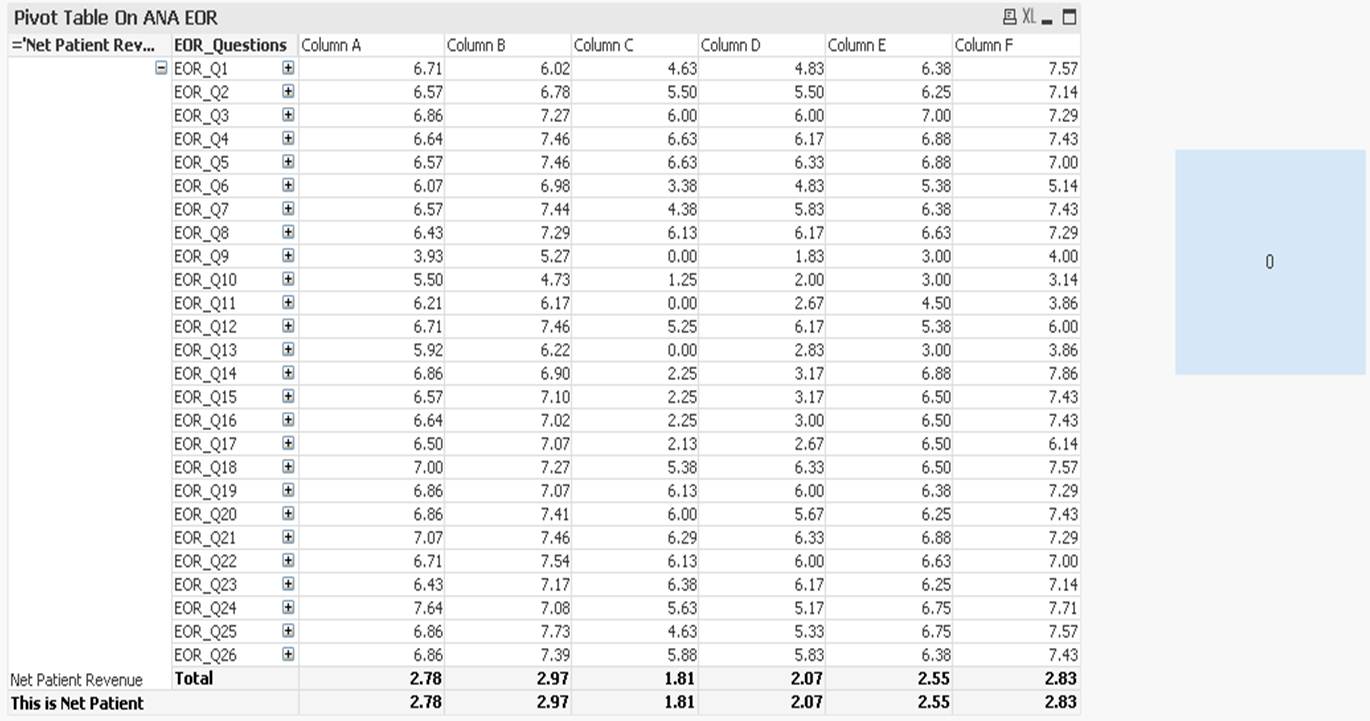
Hi Vikas,
I created a variable but I can't get the value, instead 0 is shown for the count.
Attached is the screenshot. Thanks!
- Mark as New
- Bookmark
- Subscribe
- Mute
- Subscribe to RSS Feed
- Permalink
- Report Inappropriate Content
Column A is an expression right ?
I think you can´t count´t the rows of an expression, you have to count the rows of EOR_Questions but i really can´t figure out how you can create an Expression which is only shown in the last line except the regular "total" expression which you did select.
Because an expression is, in my opinion, always calculated for every row in a pivot table. But maybe you can try something with "total" or "all" ,but it will show up in every line of you´re pivot table as a new column.
Please somebody correct me if i´m wrong !
Greetings Flo
- Mark as New
- Bookmark
- Subscribe
- Mute
- Subscribe to RSS Feed
- Permalink
- Report Inappropriate Content
Hi Florian,
Yes, it is an expression. Every column has their own expression.
Following is the Expression:
SUM({1<EOR_Subject_Name = {[Subject_A]}>}Data)/Count({1<EOR_Subject_Name = {[Subject_A]}>}EOR_Subject_Name)
I already tried "total" or "all" but what i required is Average of the Total for that column. Thanks!
Column A is an expression right ?
I think you can´t count´t the rows of an expression, you have to count the rows of EOR_Questions but i really can´t figure out how you can create an Expression which is only shown in the last line except the regular "total" expression which you did select.
Because an expression is, in my opinion, always calculated for every row in a pivot table. But maybe you can try something with "total" or "all" ,but it will show up in every line of you´re pivot table as a new column.
Please somebody correct me if i´m wrong !
Greetings Flo
- Mark as New
- Bookmark
- Subscribe
- Mute
- Subscribe to RSS Feed
- Permalink
- Report Inappropriate Content
Hi,
I think this is a typical problem that requires the function AGGR (advanced aggregations). Try with an expression like this:
AVG(AGGR(SUM({1<EOR_Subject_Name = {[Subject_A]}>}Data)/Count({1<EOR_Subject_Name = {[Subject_A]}>}EOR_Subject_Name),EOR_Questions))
Regards,
Cesar
- Mark as New
- Bookmark
- Subscribe
- Mute
- Subscribe to RSS Feed
- Permalink
- Report Inappropriate Content
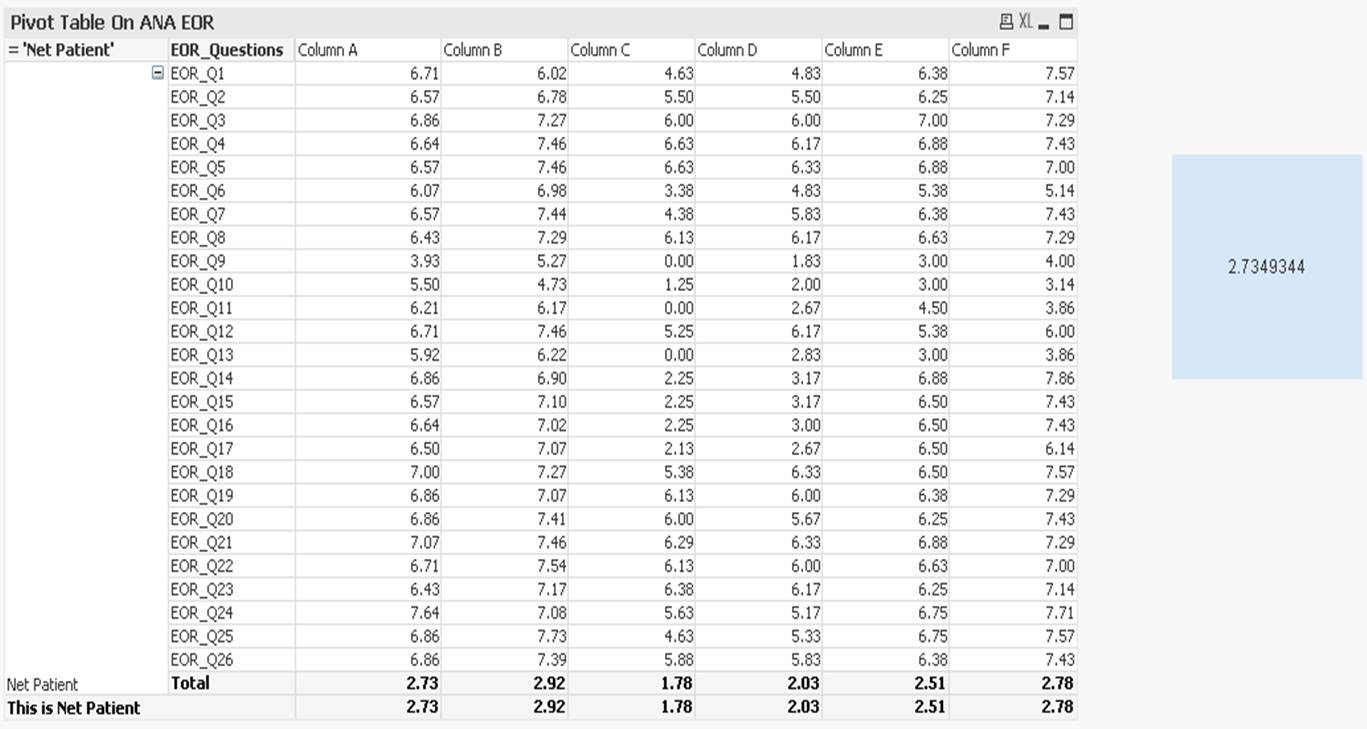
Hi Cesar,
i tried yours formula but the figure don't tally. Below is the screenshot. Answer expected at last row would be 6.71 instead of 2.73. It is because our value are also expression ?
- Mark as New
- Bookmark
- Subscribe
- Mute
- Subscribe to RSS Feed
- Permalink
- Report Inappropriate Content
I just see your case... I create a Avg(Column A) and works... Or I don't understanding you?
- Mark as New
- Bookmark
- Subscribe
- Mute
- Subscribe to RSS Feed
- Permalink
- Report Inappropriate Content
Hi,
My column A is an expression using set analysis as of below:
SUM({1<EOR_Subject_Name = {[Subject_A]}> Data)/Count({1<EOR_Subject_Name = {[Subject_A]}>}EOR_Subject_Name)
if I do an avg(col A), my answer will be 2.73 which is wrong. The total value of column A should be divided by 26, the no of questions.
Thanks
- Mark as New
- Bookmark
- Subscribe
- Mute
- Subscribe to RSS Feed
- Permalink
- Report Inappropriate Content
Hi,
Why you are using "1" in your set analysis? Is that because you want to always show all the lines?
Please try with this expression:
AVG(AGGR(AVG({$<EOR_Subject_Name = {[Subject_A]}>}Data),EOR_Subject_Name,EOR_Questions))
What's the result you get with the above expression?
Cesar
- « Previous Replies
-
- 1
- 2
- Next Replies »