Unlock a world of possibilities! Login now and discover the exclusive benefits awaiting you.
- Qlik Community
- :
- All Forums
- :
- QlikView App Dev
- :
- Average grand total instead of Sum in pivot table
- Subscribe to RSS Feed
- Mark Topic as New
- Mark Topic as Read
- Float this Topic for Current User
- Bookmark
- Subscribe
- Mute
- Printer Friendly Page
- Mark as New
- Bookmark
- Subscribe
- Mute
- Subscribe to RSS Feed
- Permalink
- Report Inappropriate Content
Average grand total instead of Sum in pivot table
Hi Experts,
Gone through some of threads however not solved the issue. Unable to share app due to confidentiality.
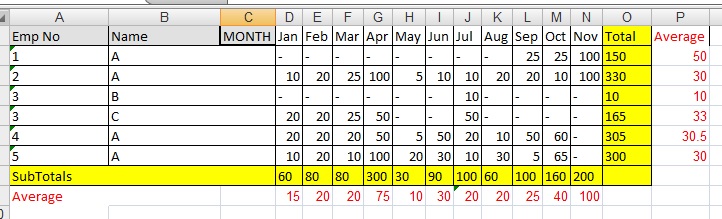
I have a pivot table in my app something like below, whereas i need to replace red number (Average) at yellow highlighted (Sum).
I have three dimensions and one expression (Ex: Sum(No)).
Is there anyway to do it by using dimensionality() or any other way?
Regards,
Raju.
Accepted Solutions
- Mark as New
- Bookmark
- Subscribe
- Mute
- Subscribe to RSS Feed
- Permalink
- Report Inappropriate Content
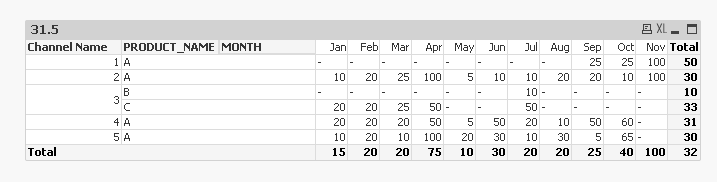
Try this:
=Avg(Aggr(If(Sum(Value) > 0, Sum(Value)), [Channel Name], PRODUCT_NAME, MONTH))
Replace Sum(Value) with your expression
Attaching a sample
- Mark as New
- Bookmark
- Subscribe
- Mute
- Subscribe to RSS Feed
- Permalink
- Report Inappropriate Content
Have you tried using Avg(No)?
- Mark as New
- Bookmark
- Subscribe
- Mute
- Subscribe to RSS Feed
- Permalink
- Report Inappropriate Content
Hi Sunny,
That will give Average values for expression.. whereas i need overall average at Totals.
I used show partial sum in presentation tab for totals, whereas i need average there.
- Mark as New
- Bookmark
- Subscribe
- Mute
- Subscribe to RSS Feed
- Permalink
- Report Inappropriate Content
Would you be able to share your sample excel file you have above? I know this can be done with Aggr() function. But the exact expression will need to be tested 
- Mark as New
- Bookmark
- Subscribe
- Mute
- Subscribe to RSS Feed
- Permalink
- Report Inappropriate Content
May i know where is the option to attach the excel. If you do not mind...
- Mark as New
- Bookmark
- Subscribe
- Mute
- Subscribe to RSS Feed
- Permalink
- Report Inappropriate Content
Step 1:

Step 2:

- Mark as New
- Bookmark
- Subscribe
- Mute
- Subscribe to RSS Feed
- Permalink
- Report Inappropriate Content
Try this:
=Avg(Aggr(If(Sum(Value) > 0, Sum(Value)), [Channel Name], PRODUCT_NAME, MONTH))
Replace Sum(Value) with your expression
Attaching a sample
- Mark as New
- Bookmark
- Subscribe
- Mute
- Subscribe to RSS Feed
- Permalink
- Report Inappropriate Content
Thank you Sunny.
- Mark as New
- Bookmark
- Subscribe
- Mute
- Subscribe to RSS Feed
- Permalink
- Report Inappropriate Content
No problem. I am glad I was able to help.
Best,
Sunny