Unlock a world of possibilities! Login now and discover the exclusive benefits awaiting you.
- Qlik Community
- :
- All Forums
- :
- QlikView App Dev
- :
- Re: Average by month in a chart
- Subscribe to RSS Feed
- Mark Topic as New
- Mark Topic as Read
- Float this Topic for Current User
- Bookmark
- Subscribe
- Mute
- Printer Friendly Page
- Mark as New
- Bookmark
- Subscribe
- Mute
- Subscribe to RSS Feed
- Permalink
- Report Inappropriate Content
Average by month in a chart
Hi,
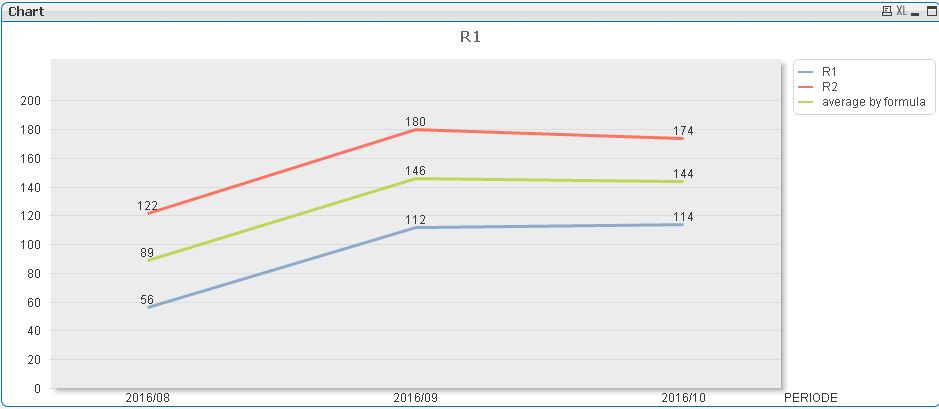
I try to calculate an average by month and area in a chart.
I tried several suggestion from different sources but none fits my requirements to 100%.
My questions are:
Is it possible to do the calculation of the sum per AREA for area 1 and 2 dynamical in one formula?
I tried this in the formula "sum per month" in my example. This works as long I don't calculate the average in the chart.
When I add the calculation of the average I get only one overall sum.
Further any kind of filters should have no effect to the calculation.
I attached my sample below.
Many thanks for your support!
Best,
Claus
Accepted Solutions
- Mark as New
- Bookmark
- Subscribe
- Mute
- Subscribe to RSS Feed
- Permalink
- Report Inappropriate Content
Check the attached out
- Mark as New
- Bookmark
- Subscribe
- Mute
- Subscribe to RSS Feed
- Permalink
- Report Inappropriate Content
Check the attached out
- Mark as New
- Bookmark
- Subscribe
- Mute
- Subscribe to RSS Feed
- Permalink
- Report Inappropriate Content
Hi Claus, for number 3) Ignore filters, you can set the expression posted by Sunny to:
Pick(Only({1} Dim), Sum({1}ODV_EH_MP), Avg({1}ODV_EH_MP))
- Mark as New
- Bookmark
- Subscribe
- Mute
- Subscribe to RSS Feed
- Permalink
- Report Inappropriate Content
Many thanks for your really fast answer!
It works correct, but I hoped there is a solution without changes on the script?
BR,
Claus
- Mark as New
- Bookmark
- Subscribe
- Mute
- Subscribe to RSS Feed
- Permalink
- Report Inappropriate Content
There might be a way (using ValueList), but it might get very messy.
- Mark as New
- Bookmark
- Subscribe
- Mute
- Subscribe to RSS Feed
- Permalink
- Report Inappropriate Content
Many thanks Ruben! This also working correct.
BR,
Claus
- Mark as New
- Bookmark
- Subscribe
- Mute
- Subscribe to RSS Feed
- Permalink
- Report Inappropriate Content
Ok, I guess its easier to add this inline table to the script instead of using the function.
As far as I tested the DIM function I can add as many values as maybe needed in the future due to upcoming new areas. This will help to solve my questions.
Many thanks again and best regards,
Claus
- Mark as New
- Bookmark
- Subscribe
- Mute
- Subscribe to RSS Feed
- Permalink
- Report Inappropriate Content
Hi Sunny,
as already mentioned the solution works perfect within a diagram or chart!
I adopted the solution to calculate Sales, Sell-out or Market Shares within diagrams and also within pivot charts.
The calculation by the below example formula works for Sales or Sell-out aggregated by month perfect:
=Pick(Only({1} Dim), SUM($(vShowVar_measure)),
sum( {1<MARKET=p(MARKET),PERIOD=p(PERIOD)>}
TOTAL<PERIOD,MARKET,PRODUCT> ($(vShowVar_measure))) / count( {1} Distinct($(vShowVar_area))))
But when I try to adopt the solution into the below formulas I get errors (no data available).
I have to calculate the values for rolling 3 month to get a straightened result for the values.
=aggr(RangeAvg(above(
=Pick(Only({1} Dim), SUM($(vShowVar_measure)),
//Start des BenchmarkTeiles
sum( {1<MARKET=p(MARKET),PERIOD=p(PERIOD)>}
TOTAL<PERIOD,MARKET,PRODUCT> ($(vShowVar_measure))) / count( {1} Distinct($(vShowVar_area))))
,0,3)),$(vShowVar_area),PERIOD)
A second example which is unfortunately not working within my QV project.
Here I tried to calculate a market share.
=Pick(Only({1} Dim), sum($(vShowVar_measure)),
sum($(vShowVar_measure))/aggr(sum({1<PERIOD=p(PERIOD),MARKET=p(MARKET)>}
TOTAL <PERIOD,MARKET,PRODUCT, $(vShowVar_area)> $(vShowVar_measure)),$(vShowVar_area),PERIOD))
The calculation of rolling 3 month or the market share are working with this formulas perfect within pivot tables.
I would be very thankful if you could have a look on this examples.
I 'm not sure, but maybe the errors are in combination to the aggr function?
Many thanks in advance and best regards
Claus
- Mark as New
- Bookmark
- Subscribe
- Mute
- Subscribe to RSS Feed
- Permalink
- Report Inappropriate Content
Would you be able to share the updated qvw where you are having this issue? Just for looking at the expression doesn't really explain much + it has been some time and I don't even remember what all we did here 