Unlock a world of possibilities! Login now and discover the exclusive benefits awaiting you.
- Qlik Community
- :
- All Forums
- :
- QlikView App Dev
- :
- Average instead of Partial sum table chart
- Subscribe to RSS Feed
- Mark Topic as New
- Mark Topic as Read
- Float this Topic for Current User
- Bookmark
- Subscribe
- Mute
- Printer Friendly Page
- Mark as New
- Bookmark
- Subscribe
- Mute
- Subscribe to RSS Feed
- Permalink
- Report Inappropriate Content
Average instead of Partial sum table chart
Hi guys,
Is it possible to get the average of an expression instead of a subtotal?
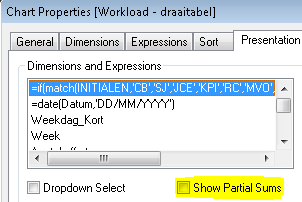
I can add the subtotal in my chart, by using the 'Show partial sums' option.

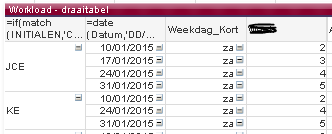
I now need the average. My table is the following (please find it below)
*dimension 1 = initials of employees
*dimension 2 = date
*dimension 3 = day (za = saturday)
The expression is a count of invoices they made that particular month [Count (DISTINCT Invoice)]
E.g. JCE made 14 invoices (2+3+4+5) in January.
I now want to add a line between JCE and KE that shows the average amount of invoices made:
(2+3+4+5)/4 days worked = 3,5invoices/day

Is this possible?
Thanks in advance
- Mark as New
- Bookmark
- Subscribe
- Mute
- Subscribe to RSS Feed
- Permalink
- Report Inappropriate Content
Check if this helps: Re: Average instead of sum in pivot table
- Mark as New
- Bookmark
- Subscribe
- Mute
- Subscribe to RSS Feed
- Permalink
- Report Inappropriate Content
If you use
Count(distinct Invoice) / Count( distinct Datum)
you will get what you want, both in the individual records and on the subtotal line.
Further, I would define my dimensions in the script. It will be faster, and easier to read (=easier to understand when you look at them i 6 months.)
See also Average – Which average?
HIC
- Mark as New
- Bookmark
- Subscribe
- Mute
- Subscribe to RSS Feed
- Permalink
- Report Inappropriate Content
Thanks for your reply.
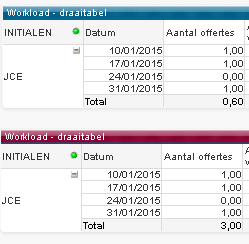
It could have been the answer, but something really funny happens:

My original expression was [Count (DISTINCT Invoice)]
Instead I am now using
=avg(aggr(Count(DISTINCT Invoice),INITIALEN,Datum))
3invoices/4days =/= 0,60
- Mark as New
- Bookmark
- Subscribe
- Mute
- Subscribe to RSS Feed
- Permalink
- Report Inappropriate Content
Try this..
avg(aggr(max(Invoice),INITIALEN,Datum)) as you need take the max of each date.. this might works