Unlock a world of possibilities! Login now and discover the exclusive benefits awaiting you.
- Qlik Community
- :
- All Forums
- :
- QlikView App Dev
- :
- Re: Average of Average Expression
- Subscribe to RSS Feed
- Mark Topic as New
- Mark Topic as Read
- Float this Topic for Current User
- Bookmark
- Subscribe
- Mute
- Printer Friendly Page
- Mark as New
- Bookmark
- Subscribe
- Mute
- Subscribe to RSS Feed
- Permalink
- Report Inappropriate Content
Average of Average Expression
Hi All,
I need to get the average across the 4 student per category highlighted in red.
For now, I can get the average score per student for each category. I am using the following expression:
=(SUM({$(eMPE_Set)}QuestionData)/
COUNT({$(eMPE_Set)} Record_No))/
Max({$(eMPE_Set)}MaxRatingScore)
The MPE expression is a set expression to get a specific exam type, example. English.
1. QuestionData is the score value.
2. Record No is a count of the number of records.
3. MaxRating Score is the maximum score of each questions.
4. The result of the above expression is translate into %.
What am I missing? Can anyone please guide me on this?
Thanks
Chun Wey
- « Previous Replies
-
- 1
- 2
- Next Replies »
Accepted Solutions
- Mark as New
- Bookmark
- Subscribe
- Mute
- Subscribe to RSS Feed
- Permalink
- Report Inappropriate Content
Try:
=Avg(Aggr(((SUM({$(eMPE_Set)}QuestionData)/
COUNT({$(eMPE_Set)} Record_No))/
Max({$(eMPE_Set)}MaxRatingScore)
), Category,[Resident Full Name]))
- Mark as New
- Bookmark
- Subscribe
- Mute
- Subscribe to RSS Feed
- Permalink
- Report Inappropriate Content
I guess you are missing TOTAL in the aggregation functions. Try like:
=(SUM(Total {$(eMPE_Set)}QuestionData)/
COUNT(Total {$(eMPE_Set)} Record_No))/
Max(Total {$(eMPE_Set)}MaxRatingScore)
If this doesn't help, try to share your sample qvw explaining the expected output there.
- Mark as New
- Bookmark
- Subscribe
- Mute
- Subscribe to RSS Feed
- Permalink
- Report Inappropriate Content
Hi,
Attached qvw for your reference. As advised, the TOTAL did not show the correct result.
If you opent the qvw, expected output is the 'Avg Score per category per cohort' line result shown. this will changed according to your cohort chosen. The answer should be same with the image attached in previous thread.
Do let me know if you any other questions.
Thanks
Chun Wey
- Mark as New
- Bookmark
- Subscribe
- Mute
- Subscribe to RSS Feed
- Permalink
- Report Inappropriate Content
Lost in your 'cohort' !  Could you be a bit more specific? chart? expression? selection?
- Mark as New
- Bookmark
- Subscribe
- Mute
- Subscribe to RSS Feed
- Permalink
- Report Inappropriate Content
Hi,
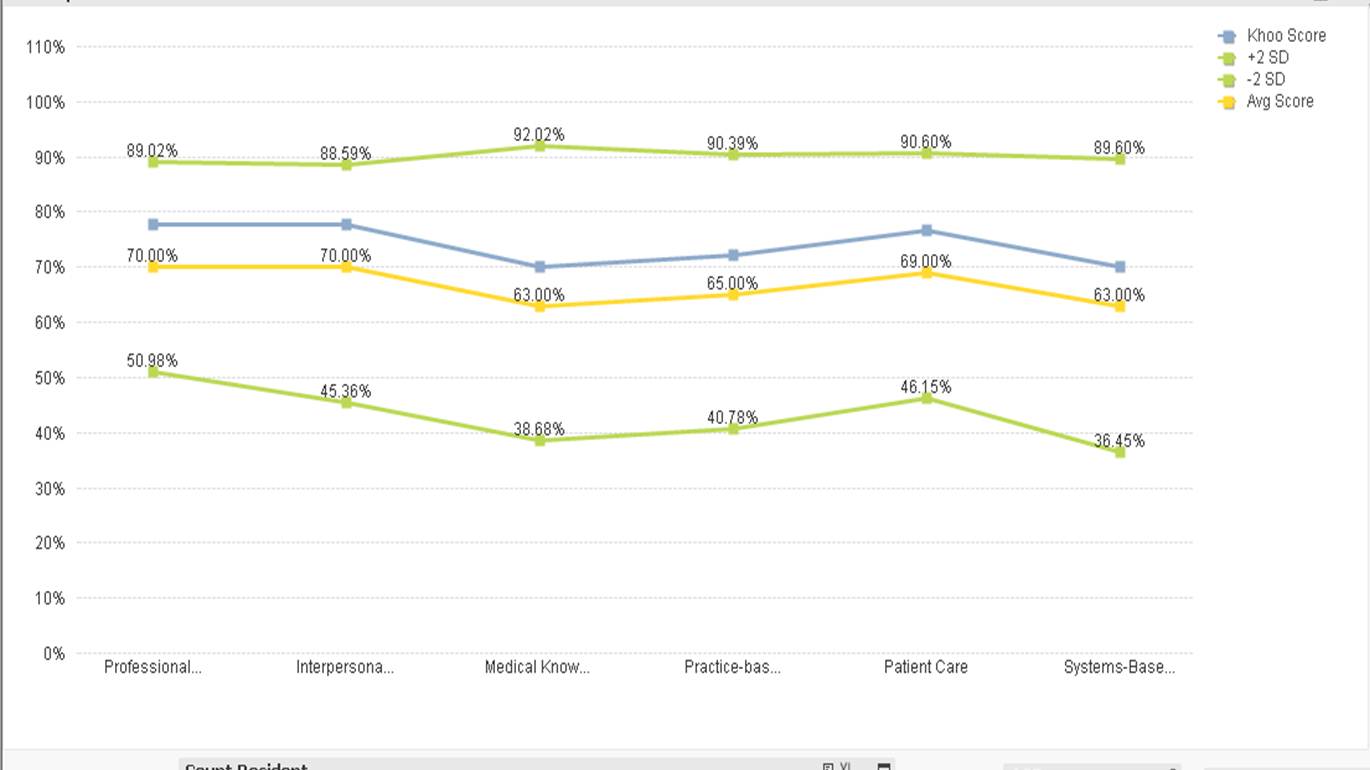
Apology. Expected Output below (Please refer to chart).
Khoo Score: Individual student Score
+2 SD: +2 Standard Deviation
-2 SD: -2 Standard Deviation
Avg Score: Average score for all students that are peers of Khoo (inclusive of Khoo result) - which is also known as cohort. In layman term, it is similar to the average score of the whole class where Khoo belongs to.
This cohort is based on a combination of Selections as of below:
Academic Year: 2013
AST: 1
I hope the above clear things up. Let me know if you have any other questions
- Mark as New
- Bookmark
- Subscribe
- Mute
- Subscribe to RSS Feed
- Permalink
- Report Inappropriate Content
Professionalism - 301/43/9 ->77.78% , but you expect 70% . Please explain the numbers(x/y/z) as you want alongwith the logic. Hope his clarification be enough for me.
- Mark as New
- Bookmark
- Subscribe
- Mute
- Subscribe to RSS Feed
- Permalink
- Report Inappropriate Content
Hi Tresesco,
That chart output is an illustration, the figure, 70%, is just an incorrect one.
Have attached excel for your reference.
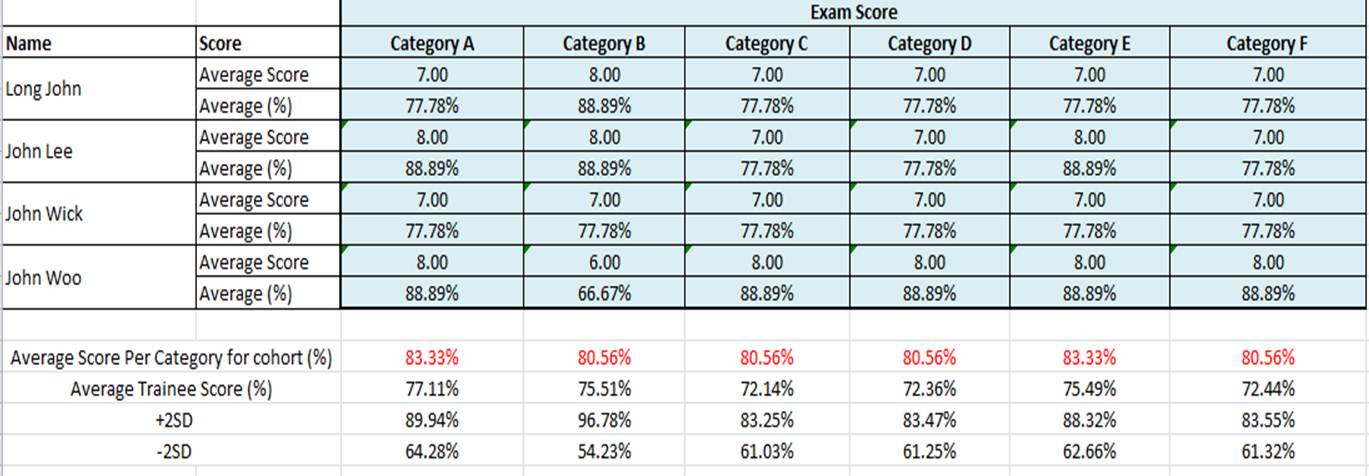
You get 77.8% because u add the raw score and divide by number of records. (In the excel sheet, I had coded in Blue background) => This is an average of all score for professionalism.
Average of Average (In the excel sheet, I had coded in yellow background) => I am trying to get this.
Step 1: I need to get an average of professionalism per student. (I have highlighted them in orange)
In this excel, I have 4 students with each average of 67.9%, 84.26%, 78.70%, 77.78%.
Step 2: I need to average this out: (67.9 + 84.26 + 78.70 + 7.78)/ 4 to get 77.16% (Figure I expected)
Thanks again for your help!
Chun Wey
- Mark as New
- Bookmark
- Subscribe
- Mute
- Subscribe to RSS Feed
- Permalink
- Report Inappropriate Content
Try:
=Avg(Aggr(((SUM({$(eMPE_Set)}QuestionData)/
COUNT({$(eMPE_Set)} Record_No))/
Max({$(eMPE_Set)}MaxRatingScore)
), Category,[Resident Full Name]))
- Mark as New
- Bookmark
- Subscribe
- Mute
- Subscribe to RSS Feed
- Permalink
- Report Inappropriate Content
Hi Tresesco,
Yes, it do give the answer i want, thanks!
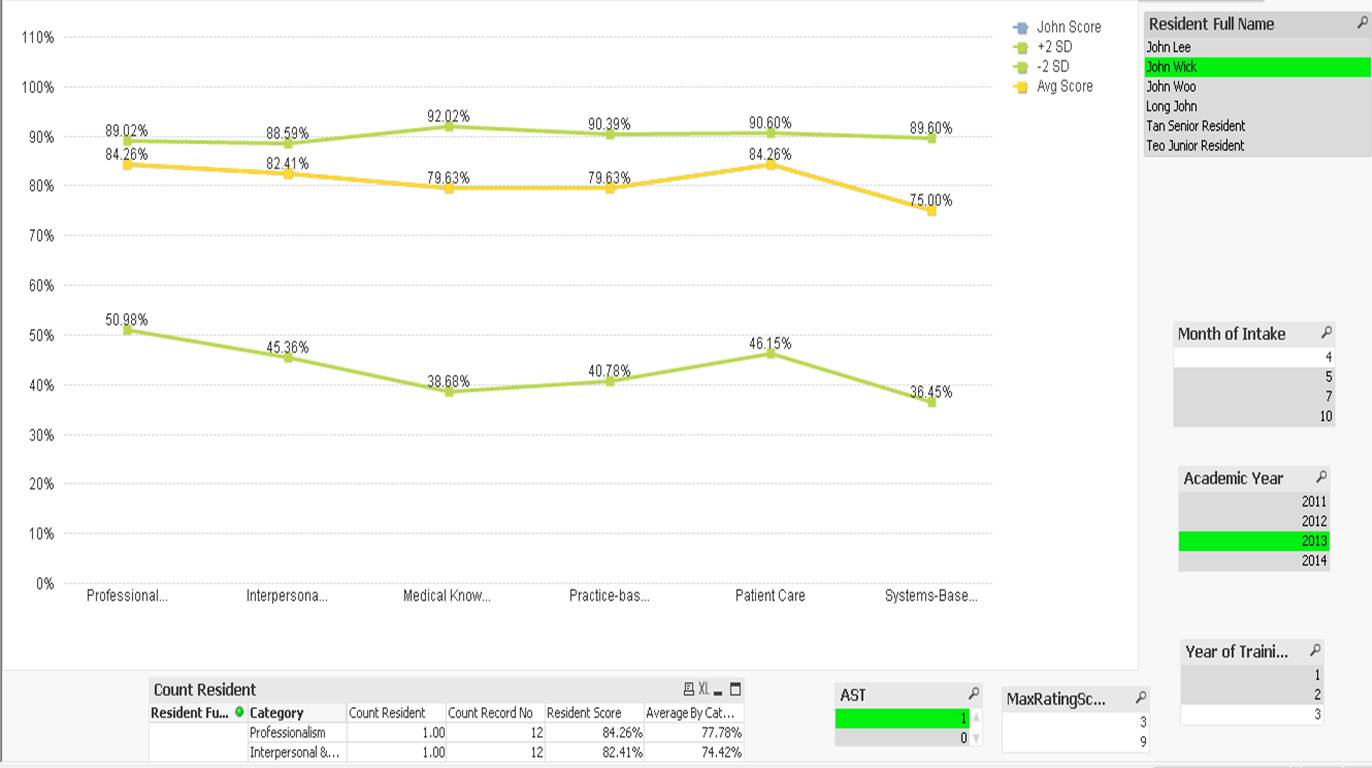
Question: How to make this Average Score to show the student class that he/she belongs to?
if I don pick any student name, the score and average overlapped which is correct as I have not selected any student names:
If I select a student name, the individual score followed the average score and they overlapped with each other:
Issue: How to make the 'Average score line' not following John score?
I can close this case if the above qns is solved.
- Mark as New
- Bookmark
- Subscribe
- Mute
- Subscribe to RSS Feed
- Permalink
- Report Inappropriate Content
Create a new variable:
Variable1 -> [Resident Full Name],QuestionType={'MPE'},IsValue={1},RatingID-={''}>
Then expression:
=Avg({<[Resident Full Name]>}Aggr(((SUM({$(Variable1)}QuestionData)/
COUNT({$(Variable1)} Record_No))/
Max({$(Variable1)}MaxRatingScore)
), Category,[Resident Full Name]))
- « Previous Replies
-
- 1
- 2
- Next Replies »