Unlock a world of possibilities! Login now and discover the exclusive benefits awaiting you.
- Qlik Community
- :
- All Forums
- :
- QlikView App Dev
- :
- Re: Average of Delta's
- Subscribe to RSS Feed
- Mark Topic as New
- Mark Topic as Read
- Float this Topic for Current User
- Bookmark
- Subscribe
- Mute
- Printer Friendly Page
- Mark as New
- Bookmark
- Subscribe
- Mute
- Subscribe to RSS Feed
- Permalink
- Report Inappropriate Content
Average of Delta's
Hello,
This is going to be my first question on the Qlik Community. I've been searching fir 2 days now and cannot find a solution for this.
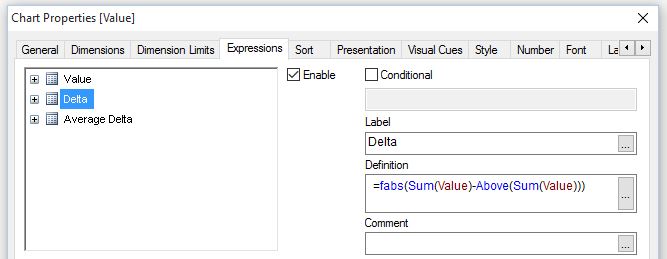
I have a where I use the ABOVE() to calculate the delta between a value and the previous one. Expression for Delta: =sqrt(sqr(Value-above(Value))).
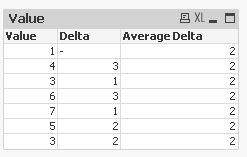
Now I'm looking for a way to average these delta's like in this example: (in this example sum of delta is 12, divided by 6 steps between groups = 2)
| Value | Delta | Average Delta |
|---|---|---|
| 1 | - | 2 |
| 4 | 3 | 2 |
| 3 | 1 | 2 |
| 6 | 3 | 2 |
| 7 | 1 | 2 |
| 5 | 2 | 2 |
| 3 | 2 | 2 |
This cannot be done in data load step because of multiple dynamic dimensions and expressions.
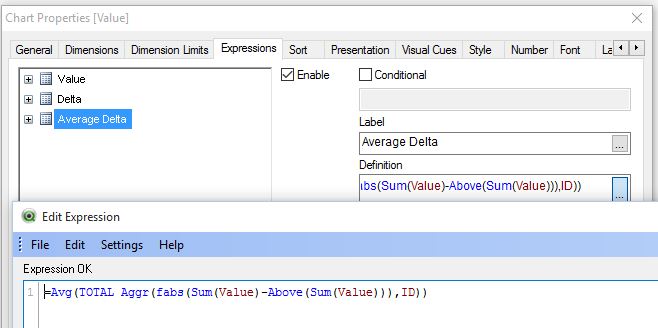
I've tried to solve it with AVG(TOTAL AGGR(SUM(Value) - ABOVE(SUM(Value)))) function but I don't get it to work in combination with ABOVE() function.
Any help is very welcome.
Regards, Jorrit
- « Previous Replies
-
- 1
- 2
- Next Replies »
Accepted Solutions
- Mark as New
- Bookmark
- Subscribe
- Mute
- Subscribe to RSS Feed
- Permalink
- Report Inappropriate Content
Hi,
maybe like this:
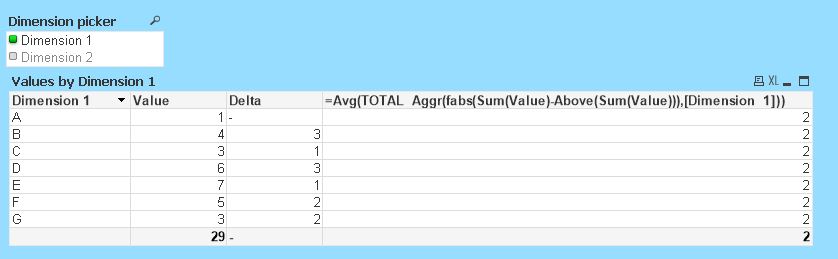
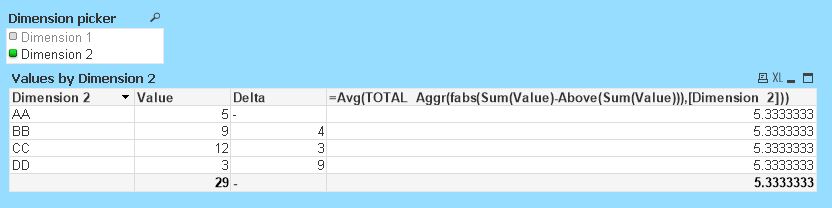
=Avg(TOTAL Aggr(fabs(Sum(Value)-Above(Sum(Value))),[$(=Dimension)]))
hope this helps
regards
Marco
- Mark as New
- Bookmark
- Subscribe
- Mute
- Subscribe to RSS Feed
- Permalink
- Report Inappropriate Content
For this you need a range-function and the optional parameters from the above-function, something like this:
rangeavg(above(Delta, 0, rowno(total)))
- Marcus
- Mark as New
- Bookmark
- Subscribe
- Mute
- Subscribe to RSS Feed
- Permalink
- Report Inappropriate Content
Hi,
one solution quite similar to yours could be:
hope this helps
regards
Marco
- Mark as New
- Bookmark
- Subscribe
- Mute
- Subscribe to RSS Feed
- Permalink
- Report Inappropriate Content
Hello Marcus,
I've tried your solution in attached qvw. It is definitely a step close than what I achieved so far but there is still 1 issue with it:
The expression averages the delta's for all rows above and including the current row, but I am looking for the average of all the rows (meaning the result is similar for all rows)
I looked into the help files for RangeAvg() and RowNo() but could not find how to make the expression take all rows (instead of only current + previous) into account.
I hope you can help me again.
Regards, Jorrit
- Mark as New
- Bookmark
- Subscribe
- Mute
- Subscribe to RSS Feed
- Permalink
- Report Inappropriate Content
Hello Marco,
I am using dynamic dimensions in my qvw. your solution gives me the the correct average delta on the lowest aggregation level, but I would not know how to implement it in a dataset with multiple aggregations.
In my example qvw (see attached) I'm using only 2 dimensions, but in real live there are going to be 15 to 20 different time levels and other groupings like by customer, by supplier, by location, etc.
Could you advise a way of doing the aggr() function without having to add an "ID" field?
Regards,
Jorrit
- Mark as New
- Bookmark
- Subscribe
- Mute
- Subscribe to RSS Feed
- Permalink
- Report Inappropriate Content
In this case might be a complete different approach helpful, like:
sum(total aggr(FABS(SUM(Value) - ABOVE (SUM(Value))), [Dimension 1])) /
(count(distinct total [Dimension 1]) - 1)
- 1 is manually because the first row will always fail but I think it could be included within the expression as condition. Further helpful could be: Average – Which average?
- Marcus
- Mark as New
- Bookmark
- Subscribe
- Mute
- Subscribe to RSS Feed
- Permalink
- Report Inappropriate Content
Try
=RangeAvg(Above(Delta, 0, RowNo(total)), Below(Delta,1, NoOfRows() ))
- Mark as New
- Bookmark
- Subscribe
- Mute
- Subscribe to RSS Feed
- Permalink
- Report Inappropriate Content
Hi,
maybe like this:
=Avg(TOTAL Aggr(fabs(Sum(Value)-Above(Sum(Value))),[$(=Dimension)]))
hope this helps
regards
Marco
- Mark as New
- Bookmark
- Subscribe
- Mute
- Subscribe to RSS Feed
- Permalink
- Report Inappropriate Content
Thanks Marco,
You and 2 others have given me a correct answer with which I can move forward.
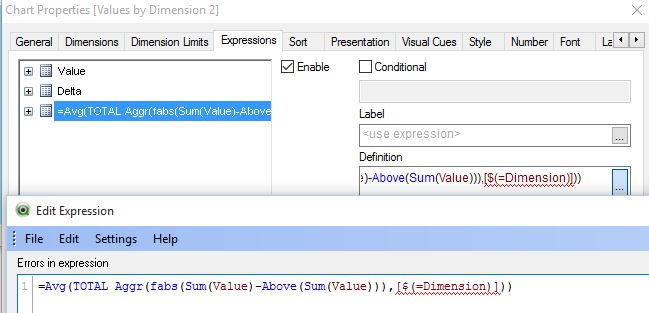
Additionally I learned from your answer about getting the dimension dynamically with `[$(=Dimension)]`. This will come in handy in future projects.
Regards,
Jorrit
- Mark as New
- Bookmark
- Subscribe
- Mute
- Subscribe to RSS Feed
- Permalink
- Report Inappropriate Content
Thanks,
You and 2 others gave the correct answer.
I like yours because I think it´s elegant to solve this using just in Chart Inter Record Functions.
Regards,
- « Previous Replies
-
- 1
- 2
- Next Replies »