Unlock a world of possibilities! Login now and discover the exclusive benefits awaiting you.
- Qlik Community
- :
- All Forums
- :
- QlikView App Dev
- :
- Re: Average of calculated formula
- Subscribe to RSS Feed
- Mark Topic as New
- Mark Topic as Read
- Float this Topic for Current User
- Bookmark
- Subscribe
- Mute
- Printer Friendly Page
- Mark as New
- Bookmark
- Subscribe
- Mute
- Subscribe to RSS Feed
- Permalink
- Report Inappropriate Content
Average of calculated formula
Hi all
I am trying to get an average of a calculated field for the past 12 months values.
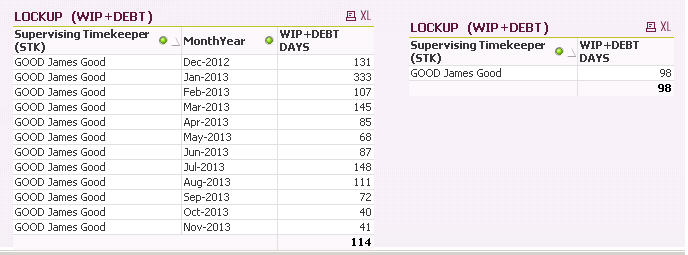
In a chart when I include the month dimension and have the total mode set to 'Average of Rows' the output on the total row shows my expected average. However, I don't wish to show each of the months - only the 12 month average, but when I remove the Month dimension the figure changes.
Can anyone suggest how I can show the average of the rows when only displaying the single row? I have tried a pivot table and this too results in 98 rather than 114.
Many thanks
Scott
- Mark as New
- Bookmark
- Subscribe
- Mute
- Subscribe to RSS Feed
- Permalink
- Report Inappropriate Content
Then you should use the Aggr() function:
Avg(Aggr(Sum(WIP+DEBT+DAYS), MonthYear))
You may need to replace Sum(WIP+DEBT+DAYS) with what you want to calculate your average on.
HIC
- Mark as New
- Bookmark
- Subscribe
- Mute
- Subscribe to RSS Feed
- Permalink
- Report Inappropriate Content
Try Something like below..
if(Dimensionality() <> 0,
Avg(Aggr(SUM(WIP+DEBT+DAYS),[Supervisiong Timekeeper (STK)] , MonthYear)),
Avg({1}Aggr(SUM({1} WIP+DEBT+DAYS), [Supervisiong Timekeeper (STK)],InvoiceMonthYear))
)
- Mark as New
- Bookmark
- Subscribe
- Mute
- Subscribe to RSS Feed
- Permalink
- Report Inappropriate Content
use total function
- Mark as New
- Bookmark
- Subscribe
- Mute
- Subscribe to RSS Feed
- Permalink
- Report Inappropriate Content
scotthay wrote:
Hi all
I am trying to get an average of a calculated field for the past 12 months values.
In a chart when I include the month dimension and have the total mode set to 'Average of Rows' the output on the total row shows my expected average. However, I don't wish to show each of the months - only the 12 month average, but when I remove the Month dimension the figure changes.
Can anyone suggest how I can show the average of the rows when only displaying the single row? I have tried a pivot table and this too results in 98 rather than 114.
Many thanks
Scott

To add to the above after trying the suggestions I am still not able to achive what I am after. I will try to detail my issue further.
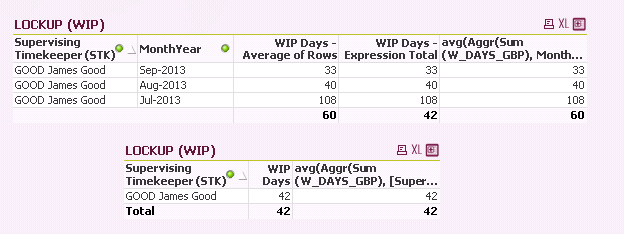
I have reduced the number of months to 3 and to explain:
The Wip Days expression is
sum(W_DAYS_GBP)/sum([WIP Amount GBP] )
and my aggr function in both objects is
avg(Aggr(Sum(W_DAYS_GBP), MonthYear, [Supervising Timekeeper (STK)]))
/
avg(Aggr(Sum([WIP Amount GBP]), MonthYear, [Supervising Timekeeper (STK)]))
The figure I am after in the bottom object should be 60 and not 42 - any suggestions will be most welcome!
Thanks
- Mark as New
- Bookmark
- Subscribe
- Mute
- Subscribe to RSS Feed
- Permalink
- Report Inappropriate Content
Try this:
avg(aggr(avg(WIP+DEBT+DAYS),MonthYear))
and set the Total Mode to Expression Total.