Unlock a world of possibilities! Login now and discover the exclusive benefits awaiting you.
- Qlik Community
- :
- All Forums
- :
- QlikView App Dev
- :
- Re: Average
- Subscribe to RSS Feed
- Mark Topic as New
- Mark Topic as Read
- Float this Topic for Current User
- Bookmark
- Subscribe
- Mute
- Printer Friendly Page
- Mark as New
- Bookmark
- Subscribe
- Mute
- Subscribe to RSS Feed
- Permalink
- Report Inappropriate Content
Average
Dear all,
Kindly advise how to compute ABERAGE in the expression instead of TOTAL.
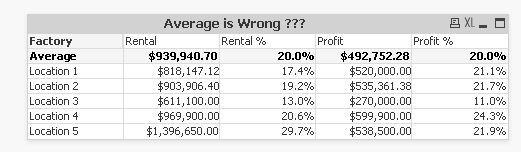
Correct Answer should be as follows :
| Factory | Rental | Rental % | Profit | Profit % |
| Average | $939,940.70 | 20.0% | $492,752.28 | 20.0% |
| Location 1 | $818,147.12 | 17.4% | $520,000.00 | 21.1% |
| Location 2 | $903,906.40 | 19.2% | $535,361.38 | 21.7% |
| Location 3 | $611,100.00 | 13.0% | $270,000.00 | 11.0% |
| Location 4 | $969,900.00 | 20.6% | $599,900.00 | 24.3% |
| Location 5 | $1,396,650.00 | 29.7% | $538,500.00 | 21.9% |
Thank You
Tracy
Accepted Solutions
- Mark as New
- Bookmark
- Subscribe
- Mute
- Subscribe to RSS Feed
- Permalink
- Report Inappropriate Content
Check it out
Avg(Aggr(sum(Rental), Factory))
Avg(Aggr(sum([Rental %]), Factory))
Avg(Aggr(sum(Profit), Factory))
Avg(Aggr(sum([Profit %]), Factory))
- Mark as New
- Bookmark
- Subscribe
- Mute
- Subscribe to RSS Feed
- Permalink
- Report Inappropriate Content
Check it out
Avg(Aggr(sum(Rental), Factory))
Avg(Aggr(sum([Rental %]), Factory))
Avg(Aggr(sum(Profit), Factory))
Avg(Aggr(sum([Profit %]), Factory))
- Mark as New
- Bookmark
- Subscribe
- Mute
- Subscribe to RSS Feed
- Permalink
- Report Inappropriate Content
Hi Tracy, if the chart was simple table instead of pivot you can set the totals to calculate as an average in the expression tab (example attached).
For pivot table you need to set the expressions as Sunny posted.
- Mark as New
- Bookmark
- Subscribe
- Mute
- Subscribe to RSS Feed
- Permalink
- Report Inappropriate Content
Dear Ruben Marin
Thank you so much for your kind support, I have learned new feature from you with example even though Sunny had resolved my problem.
Many thanks
Tracy
- Mark as New
- Bookmark
- Subscribe
- Mute
- Subscribe to RSS Feed
- Permalink
- Report Inappropriate Content
Dear all
Kindly advise how to compute Average in column(4) to derive Delta in column(5) by comparing Rental% with Average :
| Factory | Rental | Rental % | Average | Delta |
| Average | $939,940.70 | 20.0% | 20.00% | 0.0% |
| Location 1 | $818,147.12 | 17.4% | 20.00% | -2.6% |
| Location 2 | $903,906.40 | 19.2% | 20.00% | -0.8% |
| Location 3 | $611,100.00 | 13.0% | 20.00% | -7.0% |
| Location 4 | $969,900.00 | 20.6% | 20.00% | 0.6% |
| Location 5 | $1,396,650.00 | 29.7% | 20.00% | 9.7% |
Thank You
Tracy
- Mark as New
- Bookmark
- Subscribe
- Mute
- Subscribe to RSS Feed
- Permalink
- Report Inappropriate Content
Here you are

- Mark as New
- Bookmark
- Subscribe
- Mute
- Subscribe to RSS Feed
- Permalink
- Report Inappropriate Content
Dear Sunny
Thank you so much, you are very clever and helpful, I have learned something new from you.
Regards
Tracy