Unlock a world of possibilities! Login now and discover the exclusive benefits awaiting you.
- Qlik Community
- :
- All Forums
- :
- QlikView App Dev
- :
- Re: Avg of above and current month in bar chart
- Subscribe to RSS Feed
- Mark Topic as New
- Mark Topic as Read
- Float this Topic for Current User
- Bookmark
- Subscribe
- Mute
- Printer Friendly Page
- Mark as New
- Bookmark
- Subscribe
- Mute
- Subscribe to RSS Feed
- Permalink
- Report Inappropriate Content
Avg of above and current month in bar chart
Hi All,
Stuck in small point , want to show the avg of 2 month values in bar chart but for the first moth facing some issue and if I select some month den also facing little challenge .
Hopefully u given will help me out.
Selection in Appl.
| FY Name |
|---|
| 2015-16 |
| 2016-17 |
2016-18 |
| Fiscal month |
|---|
| Apr May Jun .........Dec Jan Feb Mar |
Output
Ex Mar 2015-16 Delivery is 30
| Fiscal Month | Delivery | OUTPUT (current +above)/2 | Header 4 |
|---|---|---|---|
| Apr | 100 | 65 | (Mar-16+Apr-16)/2 |
| May | 20 | 60 | (Apr-16+may-16)/2 |
| Jun | 50 | 35 | (may-16+Jun-16)/2 |
| Jul | 60 | 55 | same as above....... |
NOTE:
Facing issue in Ist row that is Apr in above table and
if some select specific month Ex May with 2016-17 then put comes incorrect..
We can do in Script also??
Accepted Solutions
- Mark as New
- Bookmark
- Subscribe
- Mute
- Subscribe to RSS Feed
- Permalink
- Report Inappropriate Content
May be this
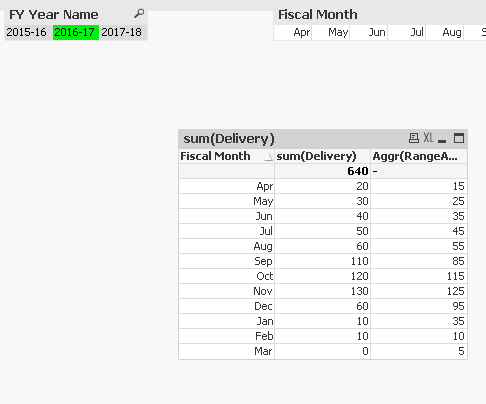
Aggr(RangeAvg(Above(Sum({<[FY Year Name]>} Delivery), 0, 2)), [Fiscal YYYYMM])
- Mark as New
- Bookmark
- Subscribe
- Mute
- Subscribe to RSS Feed
- Permalink
- Report Inappropriate Content
Can you provide sample, We can do this Front end itself
- Mark as New
- Bookmark
- Subscribe
- Mute
- Subscribe to RSS Feed
- Permalink
- Report Inappropriate Content
Hey i have attached the file , kindly check .
it may be help you.
thanks in advance
- Mark as New
- Bookmark
- Subscribe
- Mute
- Subscribe to RSS Feed
- Permalink
- Report Inappropriate Content
Hi All,
Please find the Sample data.
- Mark as New
- Bookmark
- Subscribe
- Mute
- Subscribe to RSS Feed
- Permalink
- Report Inappropriate Content
Team please share your input
- Mark as New
- Bookmark
- Subscribe
- Mute
- Subscribe to RSS Feed
- Permalink
- Report Inappropriate Content
+ stalwar1
- Mark as New
- Bookmark
- Subscribe
- Mute
- Subscribe to RSS Feed
- Permalink
- Report Inappropriate Content
May be this
Aggr(RangeAvg(Above(Sum({<[FY Year Name]>} Delivery), 0, 2)), [Fiscal YYYYMM])