Unlock a world of possibilities! Login now and discover the exclusive benefits awaiting you.
- Qlik Community
- :
- All Forums
- :
- QlikView App Dev
- :
- Re: Axis Sort & Scale
- Subscribe to RSS Feed
- Mark Topic as New
- Mark Topic as Read
- Float this Topic for Current User
- Bookmark
- Subscribe
- Mute
- Printer Friendly Page
- Mark as New
- Bookmark
- Subscribe
- Mute
- Subscribe to RSS Feed
- Permalink
- Report Inappropriate Content
Axis Sort & Scale
Hello Qlik Community!
I'm reaching out hoping to get some help on Axis Sorting & Scaling.
I have 2 charts: Line & Scatter Plot. I need to make sure that axis scale is identical on those 2 charts. The application automatically adjusted axis scale on the scatter plot. However, I am having trouble adjusting axis on the line chart to match it. I tried using class function to assign ranges, but this is not we are looking for.
The second issue is to adjust sorting on Scatter chart from oldest to newest (i.e. from 900 to 100). It seems that it should be pretty straight forward. However, I am having trouble finding the solution.
The picture is attached
Thank you for your help!
Accepted Solutions
- Mark as New
- Bookmark
- Subscribe
- Mute
- Subscribe to RSS Feed
- Permalink
- Report Inappropriate Content
For your First Part, round your days to nearest 100
your dimension will be : Round(Days,100)
If a post helps to resolve your issue, please accept it as a Solution.
- Mark as New
- Bookmark
- Subscribe
- Mute
- Subscribe to RSS Feed
- Permalink
- Report Inappropriate Content
Can you upload a sample?
That would make it much easier to assist!
- Mark as New
- Bookmark
- Subscribe
- Mute
- Subscribe to RSS Feed
- Permalink
- Report Inappropriate Content
Here is qvd. Thank you for your help!
- Mark as New
- Bookmark
- Subscribe
- Mute
- Subscribe to RSS Feed
- Permalink
- Report Inappropriate Content
For your First Part, round your days to nearest 100
your dimension will be : Round(Days,100)
If a post helps to resolve your issue, please accept it as a Solution.
- Mark as New
- Bookmark
- Subscribe
- Mute
- Subscribe to RSS Feed
- Permalink
- Report Inappropriate Content
for the second part read this post
Reversing axes on scatter chart
If a post helps to resolve your issue, please accept it as a Solution.
- Mark as New
- Bookmark
- Subscribe
- Mute
- Subscribe to RSS Feed
- Permalink
- Report Inappropriate Content
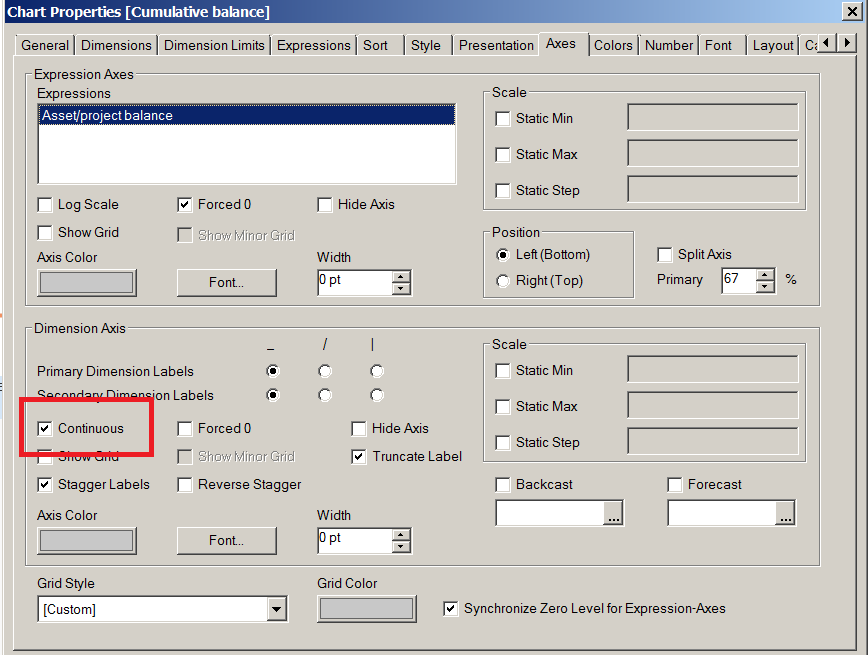
and in addition to Vineeths proposal set axis to "continous":

- Mark as New
- Bookmark
- Subscribe
- Mute
- Subscribe to RSS Feed
- Permalink
- Report Inappropriate Content
Thank you so much! I was able to solve the first part. However, I'm still having trouble with the second one. I followed steps in the post above, in particular:
1. Changed Expression to: -Sum (days)
2. Checked Static max to 0 for x-axis
3. Set number to fixed to '#,##0'
I also tried multiplying by -1 to get rid off '-' in front of days. However, the numbers are still showing in negative format.