Unlock a world of possibilities! Login now and discover the exclusive benefits awaiting you.
- Qlik Community
- :
- All Forums
- :
- QlikView App Dev
- :
- Re: Background Color
- Subscribe to RSS Feed
- Mark Topic as New
- Mark Topic as Read
- Float this Topic for Current User
- Bookmark
- Subscribe
- Mute
- Printer Friendly Page
- Mark as New
- Bookmark
- Subscribe
- Mute
- Subscribe to RSS Feed
- Permalink
- Report Inappropriate Content
Background Color
Hi,
I am color-coding cells based on their value using Background Color, like this:
IF([Growth] > '30' ,RGB(0,160,0),
IF([Growth] > '20' ,RGB(0,225,0),
IF([Growth] > '5' ,RGB(150,255,150),
IF ([Growth] >'0' ,RGB(255,255,235),
IF([Growth] > '-10' ,RGB(255,175,175),
IF([Growth] > '-20' ,RGB(255,140,140),
IF([Growth] < '-20', RGB(255,80,80))))))))
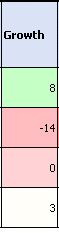
Works nicely.
But the ranges change massively based on filters. These are local results, and the numbers are never more than 30, or less than -20.
But when i remove filters and pull in the national data, the top number is more than 5000, and the bottom can be less than -2500.
Does anyone have an idea how to replace the '30' '20' '5' '0' '-10' '-20' with a variable that will calculate the background colors based on the full range of values in the Growth dimension?
Thanks for your thoughts.
JV
- Tags:
- qlikview_scripting
- Mark as New
- Bookmark
- Subscribe
- Mute
- Subscribe to RSS Feed
- Permalink
- Report Inappropriate Content
I'm guessing it will be something like
IF([Growth]/sum(TOTAL Growth) > 0.8 ,RGB(0,160,0),..
Regards,
M.
- Mark as New
- Bookmark
- Subscribe
- Mute
- Subscribe to RSS Feed
- Permalink
- Report Inappropriate Content
Hi JV, I got 2 ideas on your requirements.
Method 1: Complex IF cond depends on the Length of Growth value
IF( Len([Growth]) = 4, Write the BG cond with 5000 to -2500 range , Write the BG cond with 30 to -25 range )
This Method should work but it kills the calculation depends on the size of your data.
Method 2 : Hide/Show logic with your selections
Create the 2 charts. One chart with low range values and other chart high range values. Enable the Hide/Show logic depends on the user selections.
- Mark as New
- Bookmark
- Subscribe
- Mute
- Subscribe to RSS Feed
- Permalink
- Report Inappropriate Content
Hi Martyn,
Nice idea, but I think I need to calculate range or something instead of sum. Or have the sum do an absolute on the negative numbers. Have you ever tried this?
Thanks, JV
- Mark as New
- Bookmark
- Subscribe
- Mute
- Subscribe to RSS Feed
- Permalink
- Report Inappropriate Content
Hi Dathu,
I just showed two filter examples. In reality, there could be hundreds of filter variations, so I was hoping for a dynamic calculation that gave me the full range of values from the Growth dimension column and put the specific Growth dimension value in the correct bucket (top 20%, next 20%, third 20% fourth 20% and bottom 20%).
Another problem is that the Growth dimension is actually a number returned from an expression, not a hard dimension, so QV has trouble seeing it. (error: Bad field name(s): Growth
Any other thoughts would be appreciated.
JV
- Mark as New
- Bookmark
- Subscribe
- Mute
- Subscribe to RSS Feed
- Permalink
- Report Inappropriate Content
Growth is dimension or Expression ?
- Mark as New
- Bookmark
- Subscribe
- Mute
- Subscribe to RSS Feed
- Permalink
- Report Inappropriate Content
Please post some sample qvw and the expression depends on the ur data model as well.
- Mark as New
- Bookmark
- Subscribe
- Mute
- Subscribe to RSS Feed
- Permalink
- Report Inappropriate Content
Growth is an integer that is created from this expression:
Sum({<[4_WEEK_ROLLING_RETAIL]={"P4WTY"}>} TRX_QTY_NORM))

- Mark as New
- Bookmark
- Subscribe
- Mute
- Subscribe to RSS Feed
- Permalink
- Report Inappropriate Content
So I tried this, replacing the second Growth with the actual expression:
IF ([Growth]/sum(TOTAL Sum({<[4_WEEK_ROLLING_RETAIL]={"P4WTY"}>} TRX_QTY_NORM)) > 0.8 ,RGB(0,160,0),
IF([Growth]/sum(TOTAL Sum({<[4_WEEK_ROLLING_RETAIL]={"P4WTY"}>} TRX_QTY_NORM))) > 0.6 ,RGB(0,225,0),
IF([Growth]/sum(TOTAL Sum({<[4_WEEK_ROLLING_RETAIL]={"P4WTY"}>} TRX_QTY_NORM))) > 0.4 ,RGB(150,255,150),
IF ([Growth]/sum(TOTAL Sum({<[4_WEEK_ROLLING_RETAIL]={"P4WTY"}>} TRX_QTY_NORM))) > 0.2 ,RGB(255,255,235),
IF([Growth]/sum(TOTAL Sum({<[4_WEEK_ROLLING_RETAIL]={"P4WTY"}>} TRX_QTY_NORM))) > -0.1 ,RGB(255,175,175),
IF([Growth]/sum(TOTAL Sum({<[4_WEEK_ROLLING_RETAIL]={"P4WTY"}>} TRX_QTY_NORM))) > -0.3 ,RGB(255,140,140),
IF([Growth]/sum(TOTAL Sum({<[4_WEEK_ROLLING_RETAIL]={"P4WTY"}>} TRX_QTY_NORM))) > -0.5, RGB(255,80,80))))))))
Now there is an error in expression.