Unlock a world of possibilities! Login now and discover the exclusive benefits awaiting you.
- Qlik Community
- :
- All Forums
- :
- QlikView App Dev
- :
- Re: Background col0r condition + pivot
- Subscribe to RSS Feed
- Mark Topic as New
- Mark Topic as Read
- Float this Topic for Current User
- Bookmark
- Subscribe
- Mute
- Printer Friendly Page
- Mark as New
- Bookmark
- Subscribe
- Mute
- Subscribe to RSS Feed
- Permalink
- Report Inappropriate Content
Background col0r condition + pivot
Hi,
I have used the below condition to get the color but it is not working. Please have a look.
Condition:
=if((aggr(num((sum({<Date={$(varMaxDate)},flag={'eSign'},Category={'Complete'}>} Sales)) /(sum({<Date={$(varMaxDate)},flag={'Wet Sign'}>} Sales)+sum({<Date={$(varMaxDate)},flag={'eSign'},Category={'Complete'}>} Sales) +sum({<Date={$(varMaxDate)},flag={'eSign'},Category={'Not Complete'}>} Sales)),' #,##0.0%'),Loc,A7BANB))*100 >=70
and (aggr(num((sum({<Date={$(varMaxDate)},flag={'eSign'},Category={'Complete'}>} Sales)) /(sum({<Date={$(varMaxDate)},flag={'Wet Sign'}>} Sales)+sum({<Date={$(varMaxDate)},flag={'eSign'},Category={'Complete'}>} Sales) +sum({<Date={$(varMaxDate)},flag={'eSign'},Category={'Not Complete'}>} Sales)),' #,##0.0%'),Loc,A7BANB)*100) <90,RGB(252,219,8) ,
if((aggr(num((sum({<Date={$(varMaxDate)},flag={'eSign'},Category={'Complete'}>} Sales)) /(sum({<Date={$(varMaxDate)},flag={'Wet Sign'}>} Sales)+sum({<Date={$(varMaxDate)},flag={'eSign'},Category={'Complete'}>} Sales) +sum({<Date={$(varMaxDate)},flag={'eSign'},Category={'Not Complete'}>} Sales)),' #,##0.0%'),Loc,A7BANB)*100)>=90,rgb(0,238,0),
if((aggr(num((sum({<Date={$(varMaxDate)},flag={'eSign'},Category={'Complete'}>} Sales)) /(sum({<Date={$(varMaxDate)},flag={'Wet Sign'}>} Sales)+sum({<Date={$(varMaxDate)},flag={'eSign'},Category={'Complete'}>} Sales) +sum({<Date={$(varMaxDate)},flag={'eSign'},Category={'Not Complete'}>} Sales)),' #,##0.0%'),Loc,A7BANB)*100)<70,rgb(255,69,0))))
Thanks..
- Mark as New
- Bookmark
- Subscribe
- Mute
- Subscribe to RSS Feed
- Permalink
- Report Inappropriate Content
Just by looking at this humongous expression we are suppose to know what is wrong with it and why it isn't working? All the best bro... I hope someone can really decipher this for you ![]()
- Mark as New
- Bookmark
- Subscribe
- Mute
- Subscribe to RSS Feed
- Permalink
- Report Inappropriate Content
Hi,
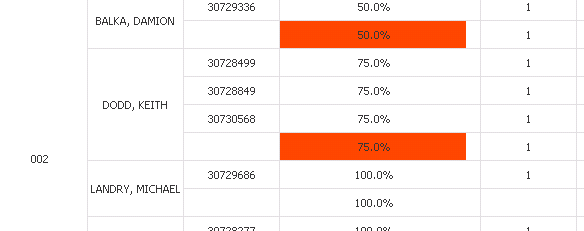
Only few cells were highlighted.Please find below.

Thanks..
- Mark as New
- Bookmark
- Subscribe
- Mute
- Subscribe to RSS Feed
- Permalink
- Report Inappropriate Content
Why not use Visual Cues tab and your already calculated expression?
- Mark as New
- Bookmark
- Subscribe
- Mute
- Subscribe to RSS Feed
- Permalink
- Report Inappropriate Content
Like this:
- Mark as New
- Bookmark
- Subscribe
- Mute
- Subscribe to RSS Feed
- Permalink
- Report Inappropriate Content
Maybe you can use Custom Format Cell to give your color expression?
Enable the 'Design Grid' from the view option on the top left. Then right click on the column you want to change the color.
Give your color expression there and check if it works?
And if you can add the below expression to a Variable?
vExp =
if((aggr(num((sum({<Date={$(varMaxDate)},flag={'eSign'},Category={'Complete'}>} Sales)) /(sum({<Date={$(varMaxDate)},flag={'Wet Sign'}>} Sales)+sum({<Date={$(varMaxDate)},flag={'eSign'},Category={'Complete'}>} Sales) +sum({<Date={$(varMaxDate)},flag={'eSign'},Category={'Not Complete'}>} Sales)),' #,##0.0%'),Loc,A7BANB)*100)
and for defining the color use
if($(vExp)<70,rgb(255,69,0))
- Mark as New
- Bookmark
- Subscribe
- Mute
- Subscribe to RSS Feed
- Permalink
- Report Inappropriate Content
Hi,
I have done the same but it's not working.
Thanks..
- Mark as New
- Bookmark
- Subscribe
- Mute
- Subscribe to RSS Feed
- Permalink
- Report Inappropriate Content
I think in your dimension you have 3 fields and you are using only Two fields in aggr part of the expression, that is why the color is only at aggr of first two columns.
- Mark as New
- Bookmark
- Subscribe
- Mute
- Subscribe to RSS Feed
- Permalink
- Report Inappropriate Content
I agree with Staffan that Visual Cues is probably the easiest and best approach here.
But suppose you can't use Visual Cues because you are doing something more complicated or using more colors than Visual Cues allows. I'll assume the expression calculating the value in your background color is the same as your chart expression, Assume that expression is labeled "Margin". In that case, you can simply refer to the label of the expression in your background color:
if(Margin * 100 > 90, green(),
,if(Margin * 100 > 70, yellow()
,red()))
If you don't want to depend on the label name, then you can use to the Column() function to refer to the nth expression:
if(Column(1) * 100 > 90, green(),
,if(Column(1) > 70, yellow()
,red()))
Much more efficient than repeating the expression,
-Rob
- Mark as New
- Bookmark
- Subscribe
- Mute
- Subscribe to RSS Feed
- Permalink
- Report Inappropriate Content
Hi,
I have used it as an Calculated Dimension.
Thanks..