Unlock a world of possibilities! Login now and discover the exclusive benefits awaiting you.
- Qlik Community
- :
- All Forums
- :
- QlikView App Dev
- :
- Bar Chart Color Based on the Condition
- Subscribe to RSS Feed
- Mark Topic as New
- Mark Topic as Read
- Float this Topic for Current User
- Bookmark
- Subscribe
- Mute
- Printer Friendly Page
- Mark as New
- Bookmark
- Subscribe
- Mute
- Subscribe to RSS Feed
- Permalink
- Report Inappropriate Content
Bar Chart Color Based on the Condition
Hi Qlikers,
I want to Fill a Color in Bar Chart Based on Conditional,
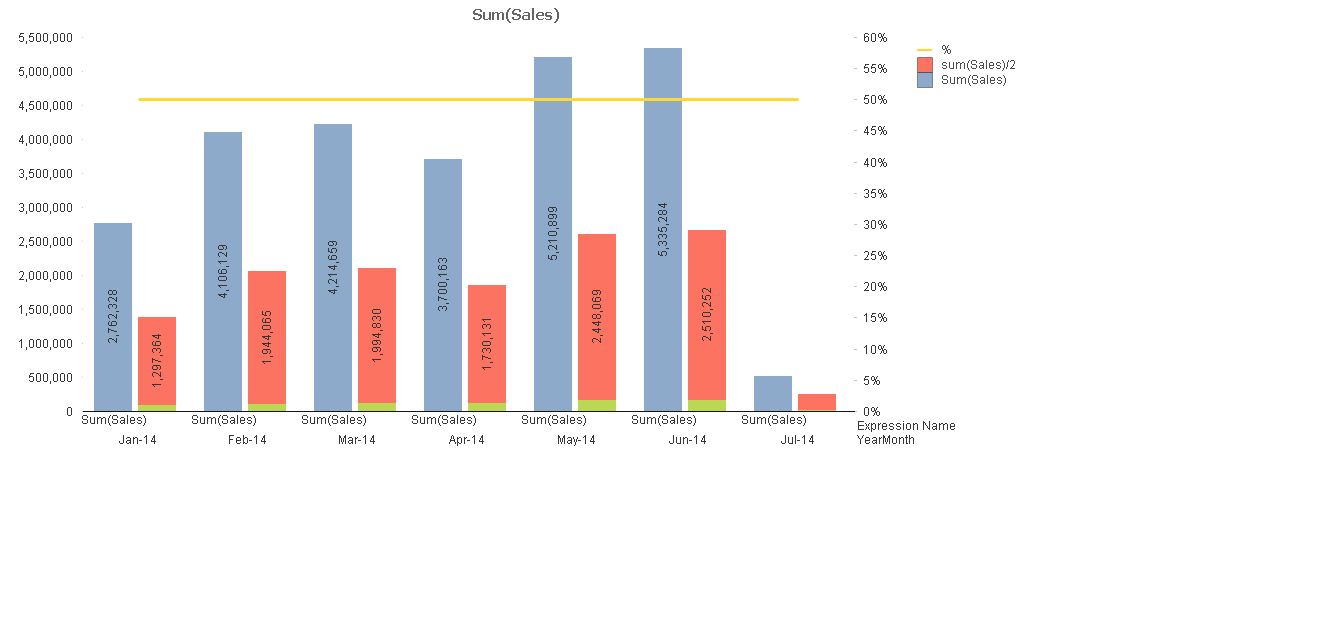
Here in the Bar Chart image with ,
One Dimension - YearMonth
Expressions: 1.Sum(Sales)
2.Sum(Sales)/2
In the Second Expression Bar, i need to include Sum(Quantity) as Green Color. Means For example in Jan-14 Value is '1381164' as its showing red .In that bar itself till Sum(Quantity) Value '8,380' it should be in green.
Thanks in advance,
Hirish
- « Previous Replies
-
- 1
- 2
- Next Replies »
- Mark as New
- Bookmark
- Subscribe
- Mute
- Subscribe to RSS Feed
- Permalink
- Report Inappropriate Content
PFA.
- Mark as New
- Bookmark
- Subscribe
- Mute
- Subscribe to RSS Feed
- Permalink
- Report Inappropriate Content
Hi jagan,
The Percentage is 50% Right but its been at the bottom,It should be as per the right side axes on top of the bars.
-Hirish
- Mark as New
- Bookmark
- Subscribe
- Mute
- Subscribe to RSS Feed
- Permalink
- Report Inappropriate Content
Hi,
Yes this is what in the attached file. Check the Axes for all the expressions, for % it should be right for the remaining expressions it should be Left.
Regards,
Jagan.
- Mark as New
- Bookmark
- Subscribe
- Mute
- Subscribe to RSS Feed
- Permalink
- Report Inappropriate Content
Where as ,50 % value is showing on 0% line on the axes. please help out with that.it should be on top at 50% as of axes.
-Hirish
- Mark as New
- Bookmark
- Subscribe
- Mute
- Subscribe to RSS Feed
- Permalink
- Report Inappropriate Content
Hi,
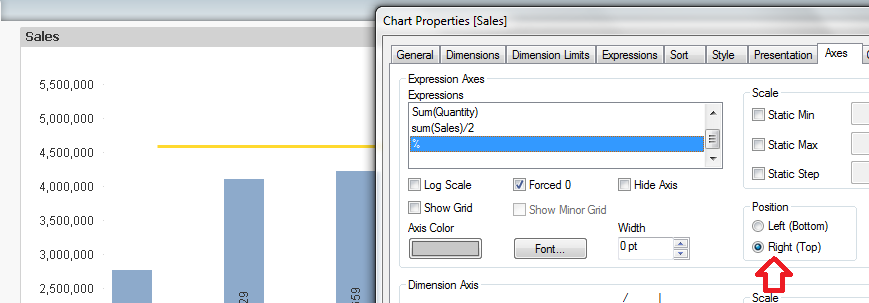
I am seeing the line at 50% . Check the image below.

- Mark as New
- Bookmark
- Subscribe
- Mute
- Subscribe to RSS Feed
- Permalink
- Report Inappropriate Content
As here it is like this,what i m seeing on Same QVW as you shared with me.
whats this issue ,
Help out,
Hirish
- Mark as New
- Bookmark
- Subscribe
- Mute
- Subscribe to RSS Feed
- Permalink
- Report Inappropriate Content
Change the axis position : Right(Top) for % expression and for rest all Left (Bottom).

- Mark as New
- Bookmark
- Subscribe
- Mute
- Subscribe to RSS Feed
- Permalink
- Report Inappropriate Content
(sum(sales)/2)/Sum(Sales) will give always '1/2'.
u can take a reference line also, or u want only the expression?
- Mark as New
- Bookmark
- Subscribe
- Mute
- Subscribe to RSS Feed
- Permalink
- Report Inappropriate Content
Hi,
Its same selected for the axes ,But its displaying like that,
In QV 11 on test its working fine,
But on QV 12 its displaying like this.
Help on this!!
PFA,
Hirish
- Mark as New
- Bookmark
- Subscribe
- Mute
- Subscribe to RSS Feed
- Permalink
- Report Inappropriate Content
Hi Hirish V,
Please check this attachment.
Susovan
- « Previous Replies
-
- 1
- 2
- Next Replies »