Unlock a world of possibilities! Login now and discover the exclusive benefits awaiting you.
- Qlik Community
- :
- All Forums
- :
- QlikView App Dev
- :
- Re: Bar Chart expression
- Subscribe to RSS Feed
- Mark Topic as New
- Mark Topic as Read
- Float this Topic for Current User
- Bookmark
- Subscribe
- Mute
- Printer Friendly Page
- Mark as New
- Bookmark
- Subscribe
- Mute
- Subscribe to RSS Feed
- Permalink
- Report Inappropriate Content
Bar Chart expression
Hi Team,
I want to show the Total Value for Each month at the top of the each bar. Eg: 1000 - at 0314 bar , 2000 - 0614 bar etc..
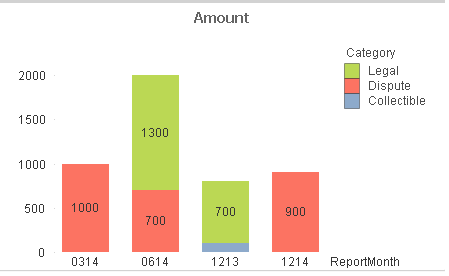
Can this possible?
- « Previous Replies
-
- 1
- 2
- Next Replies »
- Mark as New
- Bookmark
- Subscribe
- Mute
- Subscribe to RSS Feed
- Permalink
- Report Inappropriate Content
Hi Taras,
You gave me a good option, Now atleast i can able to show total value as shown below.
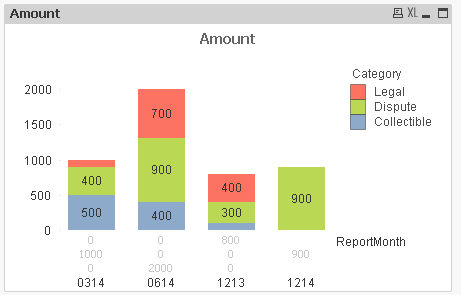
But it is showing 3 values as it contains 3 categories, How to eliminate this? I have attached sample report. Thank you.
- Mark as New
- Bookmark
- Subscribe
- Mute
- Subscribe to RSS Feed
- Permalink
- Report Inappropriate Content
ok. i got interested 
i put this expression in the subtitle to space out the totals horizontally across the top
= concat( aggr(sum(total <ReportMonth> Value),ReportMonth) , Repeat(' ',160/count( DISTINCT ReportMonth)) ,ReportMonth)
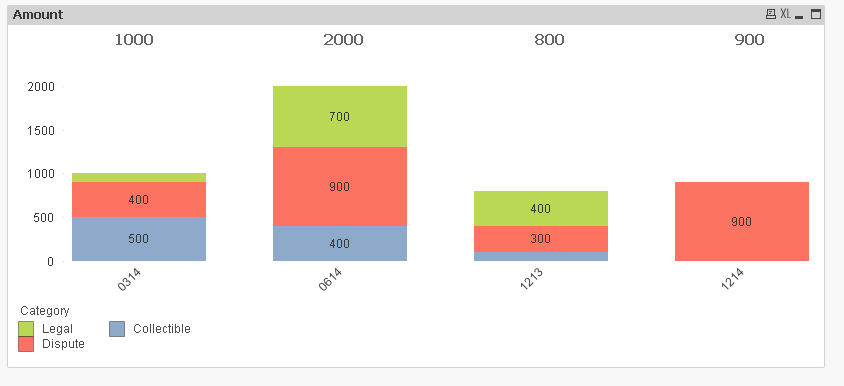
hold down the CTRL/SHIFT key and click the chart ,you will see red lines and you can move the legend, title around as you see fit. i found the spacing works better if the legend is NOT on the side but play with it, maybe you can get it to work by pushing the title a little left off center.
in the expression above play with the '160' number if you resize the chart to space the totals right.
good luck !
- Mark as New
- Bookmark
- Subscribe
- Mute
- Subscribe to RSS Feed
- Permalink
- Report Inappropriate Content
@@Plz check attached
- Mark as New
- Bookmark
- Subscribe
- Mute
- Subscribe to RSS Feed
- Permalink
- Report Inappropriate Content
Hi Jhansi,
Please check attached file.
Hope it will help you
- Mark as New
- Bookmark
- Subscribe
- Mute
- Subscribe to RSS Feed
- Permalink
- Report Inappropriate Content
That's a fantastic idea. Thanks a lot for your help...
- Mark as New
- Bookmark
- Subscribe
- Mute
- Subscribe to RSS Feed
- Permalink
- Report Inappropriate Content
Thanks to all for your cooperation. I got a solution.
- « Previous Replies
-
- 1
- 2
- Next Replies »