Unlock a world of possibilities! Login now and discover the exclusive benefits awaiting you.
- Qlik Community
- :
- All Forums
- :
- QlikView App Dev
- :
- Re: Bar Chart with accomplished tasks
- Subscribe to RSS Feed
- Mark Topic as New
- Mark Topic as Read
- Float this Topic for Current User
- Bookmark
- Subscribe
- Mute
- Printer Friendly Page
- Mark as New
- Bookmark
- Subscribe
- Mute
- Subscribe to RSS Feed
- Permalink
- Report Inappropriate Content
Bar Chart with accomplished tasks
Hello QV Experts,
I need to create metric showing performance of tasks each working day.
Tasks are done by 3 people:
- first person working from 0:00 till 7:59
- second person working from 8:00 till 15:59
- third person working from 16:00 till 23:59
In the X-axis I have days, each day contains three bars (1,2,3 person) and they show performence (amount of tasks done that day/all task assigned to the person that day)
If the task comes on 22/12/2017 16:30 it should be done by person 3, but if it has not been done by person 3 it should goes to person 1 (if done by person 1 it should be included to his performence as task done on 23/12/2017), afterwards (if still not done) to person 2 and so on unitl the task is completed
Example of the table:
| Task | TaskStartDate | TaskEndDate |
|---|---|---|
| task1 | 22/12/2017 16:30 | 23/12/2017 11:00 |
| task2 | 09/01/2018 12:20 | null |
| task3 | 06/01/2018 06:00 | null |
| task4 | 12/12/2017 15:00 | 13/12/2017 14:00 |
| task5 | 14/12/2017 9:00 | 15/12/2017 6:00 |
| task6 | 03/12/2017 14:00 | 6/12/2017 11:00 |
I have problem with the script. How to make that task (TaskStartDate) will be moving from one person to another until is done? Should I use some loop? Could you please advise how it should look like?
Thanks in advance for your comments
- Tags:
- qlikview_scripting
Accepted Solutions
- Mark as New
- Bookmark
- Subscribe
- Mute
- Subscribe to RSS Feed
- Permalink
- Report Inappropriate Content
Hi Krzysztof,
Well, it really takes me some times to do that, but it's interesting.
Hope that's what you want.
Thanks
Aiolos
- Mark as New
- Bookmark
- Subscribe
- Mute
- Subscribe to RSS Feed
- Permalink
- Report Inappropriate Content
Hi Krzysztof,
Because I don't have the real data and real data model, but according to what you said,
I think maybe you need to see the data from another perspective. Because I think according to you said, just when the task is done, then you know whom the task really belong to.
So for the tasks that is not done. if your dashboard is real-time, I think you can try to join these tasks to the different person according to the time.
If what I understood is wrong, please let me know. And if you can give a scenario, that would be better.
Thanks.
Aiolos
- Mark as New
- Bookmark
- Subscribe
- Mute
- Subscribe to RSS Feed
- Permalink
- Report Inappropriate Content
Hi Aiolos,
Thanks for your comment
Lets consider only task2 and task3 from the table in my first message. Lets assume they have been completed 10/01/2018 at 11:30
| Task | TaskStartDate | TaskEndDate |
|---|---|---|
| task2 | 09/01/2018 12:20 | 10/01/2018 11:30 |
| task3 | 06/01/2018 06:00 | 10/01/2018 17:30 |
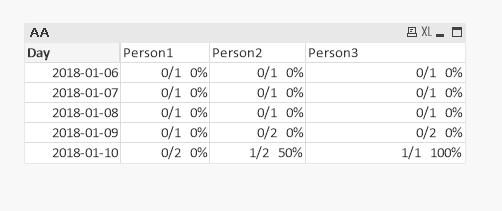
So the table for the chart will be like below:
[0/1 means 1 task has been assigned, but not done, therefore performance is 0%)
X-axis shows each day, Y-axis performance
| Day | Person1 | Person2 | Person3 |
|---|---|---|---|
| 06/01/2018 | 0/1 0% | 0/1 0% | 0/1 0% |
| 07/01/2018 | 0/1 0% | 0/1 0% | 0/1 0% |
| 08/01/2018 | 0/1 0% | 0/1 0% | 0/1 0% |
| 09/01/2018 | 0/1 0% | 0/2 0% | 0/2 0% |
| 10/01/2018 | 0/2 0% | 1/2 50% | 1/1 100% |
The main issue which I have is how to make the uncompleted task will be 'moving" until is done
Hope this shows better what I would like to make in qlikview
Thank in advance
- Mark as New
- Bookmark
- Subscribe
- Mute
- Subscribe to RSS Feed
- Permalink
- Report Inappropriate Content
Hello,
Has anybody any idea how to solve this? Thanks
- Mark as New
- Bookmark
- Subscribe
- Mute
- Subscribe to RSS Feed
- Permalink
- Report Inappropriate Content
Hi Krzysztof,
Well, it really takes me some times to do that, but it's interesting.
Hope that's what you want.
Thanks
Aiolos
- Mark as New
- Bookmark
- Subscribe
- Mute
- Subscribe to RSS Feed
- Permalink
- Report Inappropriate Content
Thank you Aiolos, this is exactly what I was expecting and it works perfectly
Really appreciated your help
Thanks,
Krzysztof
- Mark as New
- Bookmark
- Subscribe
- Mute
- Subscribe to RSS Feed
- Permalink
- Report Inappropriate Content
You are welcome. It's also glad to help you.
Aiolos