Unlock a world of possibilities! Login now and discover the exclusive benefits awaiting you.
- Qlik Community
- :
- All Forums
- :
- QlikView App Dev
- :
- Bar chart display
- Subscribe to RSS Feed
- Mark Topic as New
- Mark Topic as Read
- Float this Topic for Current User
- Bookmark
- Subscribe
- Mute
- Printer Friendly Page
- Mark as New
- Bookmark
- Subscribe
- Mute
- Subscribe to RSS Feed
- Permalink
- Report Inappropriate Content
Bar chart display
Hi Team,
I have column called CAL_Period. The data in the column is of the of format 'YYYYMM'
The starting value is 199305, End value is 201612.
Question:
I need to show 4 bars in bar chart. 1st bar current year, 2nd for current year -1, 3rd for current year-2, 4th for current year -3. These bars should display from right to left.
That is , 2013, 2014, 2015, 2016
for 2013 bar, i need to show the sum of my measure starting from 199305 to 201312
for 2014 bar, i need to show from 199305 to 201412
for 2015 bar, i need to show from 199305 to 201512
for 2016 bar, i need to show from 199305 to 201612
How to implement this.
Regards
Srinivas
- « Previous Replies
-
- 1
- 2
- Next Replies »
- Mark as New
- Bookmark
- Subscribe
- Mute
- Subscribe to RSS Feed
- Permalink
- Report Inappropriate Content
and here is a complete, no hard coded years solution
- Mark as New
- Bookmark
- Subscribe
- Mute
- Subscribe to RSS Feed
- Permalink
- Report Inappropriate Content
Alternate solution without using complicated expression and thru backend script is,
LOAD *,
if(Left(Cal_Period,4)<=2013, 2013, Left(Cal_Period,4)) as RYear,
Cal_Period,
Sales
FROM
(ooxml, embedded labels, table is Sheet1);
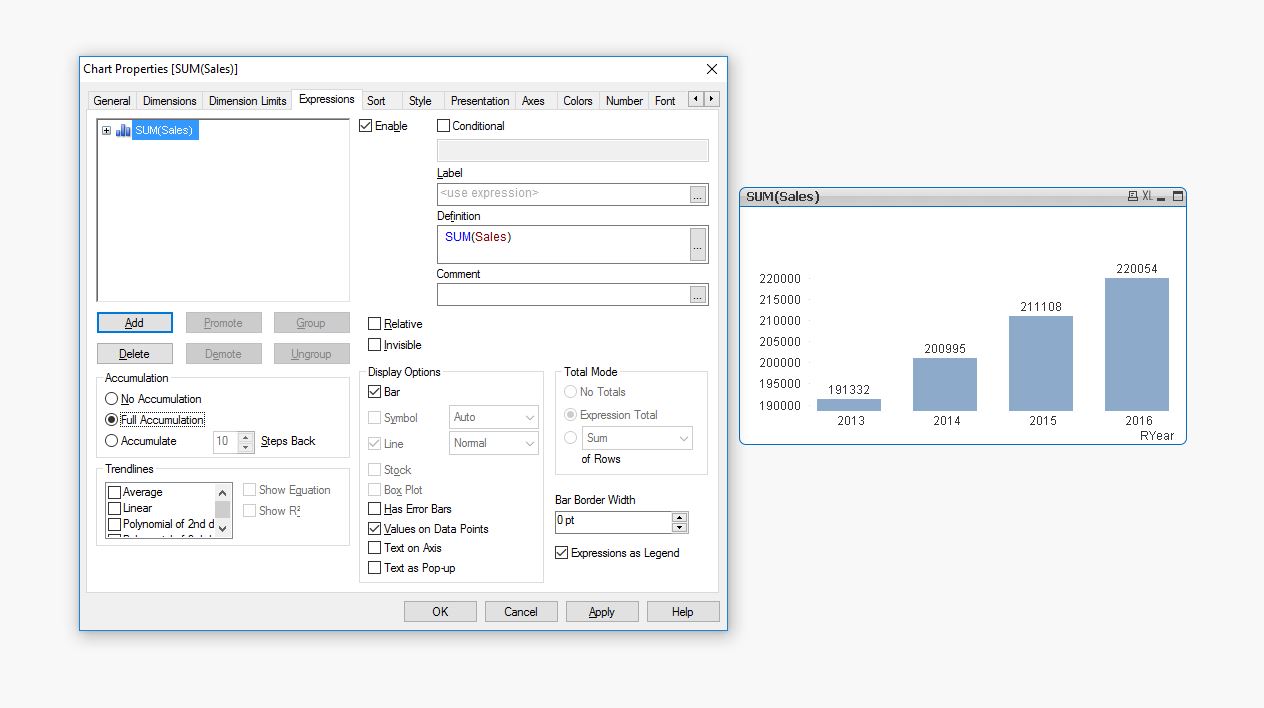
Then use this RYear in your bar chart as dimension, and use sum(sales) as expression and check the Full Accumulation option in Expression tab.
Regard,
Ganesh
- « Previous Replies
-
- 1
- 2
- Next Replies »