Unlock a world of possibilities! Login now and discover the exclusive benefits awaiting you.
- Qlik Community
- :
- All Forums
- :
- QlikView App Dev
- :
- Bar chart - formatting question
- Subscribe to RSS Feed
- Mark Topic as New
- Mark Topic as Read
- Float this Topic for Current User
- Bookmark
- Subscribe
- Mute
- Printer Friendly Page
- Mark as New
- Bookmark
- Subscribe
- Mute
- Subscribe to RSS Feed
- Permalink
- Report Inappropriate Content
Bar chart - formatting question
Hi,
I am looking at a Bar Chart that was created by another developer. Here's a screenshot.
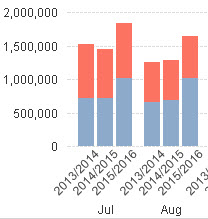
I pretty much have compared every setting between my version and the one created by someone else and I don't see any
difference. But I can't multiple years to group together like they had it. In the above, when the app is first loaded without making any selection, the bar chart shows the last highest 3 years for Jul, Aug, Sept and etc.. The expression is coded as max(year), max(year)-1
and max(year)-2. When I do the same on my version, it only shows one year at a time. For example: 2016 Jul, 2016 Aug and etc. Then when I make a selection on Year 2015, it will show 2015 Jul, 2015 Aug and etc.
What am I missing or how do you make it so it will look like the above?
Thank you
- « Previous Replies
-
- 1
- 2
- Next Replies »
- Mark as New
- Bookmark
- Subscribe
- Mute
- Subscribe to RSS Feed
- Permalink
- Report Inappropriate Content
what is the difference in set Analysis?
can you post the Expression of both Versions (that one which works and your part?)
- Mark as New
- Bookmark
- Subscribe
- Mute
- Subscribe to RSS Feed
- Permalink
- Report Inappropriate Content
Finally figured out !!
This expression doesn't work
= -1 * SUM( {
1
<
FiscalYear={$(=max(FiscalYear)), $(=max(FiscalYear)-1)},
Location={'EAST'}
>
}
Total
)
However this works. It seems the bar chart needs 3 sets of years. Can you guys confirm this with me?
Everyday is a learning day for me.
= -1 * SUM( {
1
<
FiscalYear={$(=max(FiscalYear)), $(=max(FiscalYear)-1), $(=max(FiscalYear)-2)},
Location={'EAST'}
>
}
Total
)
- Mark as New
- Bookmark
- Subscribe
- Mute
- Subscribe to RSS Feed
- Permalink
- Report Inappropriate Content
great that you found it
With Qlikview you always learn something new, even if you have years of experience
- Mark as New
- Bookmark
- Subscribe
- Mute
- Subscribe to RSS Feed
- Permalink
- Report Inappropriate Content
But am I correct the Bar Chart needs a minimum of 3 sets of fiscal year of data in order to display the data as shown in my original screenshot?
- Mark as New
- Bookmark
- Subscribe
- Mute
- Subscribe to RSS Feed
- Permalink
- Report Inappropriate Content
that's correct. otherwise there are missing years
you force Qlikview to get data from those years you specify in set analysis
- « Previous Replies
-
- 1
- 2
- Next Replies »