Unlock a world of possibilities! Login now and discover the exclusive benefits awaiting you.
- Qlik Community
- :
- All Forums
- :
- QlikView App Dev
- :
- Re: Bar chart legend to be interactive
- Subscribe to RSS Feed
- Mark Topic as New
- Mark Topic as Read
- Float this Topic for Current User
- Bookmark
- Subscribe
- Mute
- Printer Friendly Page
- Mark as New
- Bookmark
- Subscribe
- Mute
- Subscribe to RSS Feed
- Permalink
- Report Inappropriate Content
Bar chart legend to be interactive
Hi All,
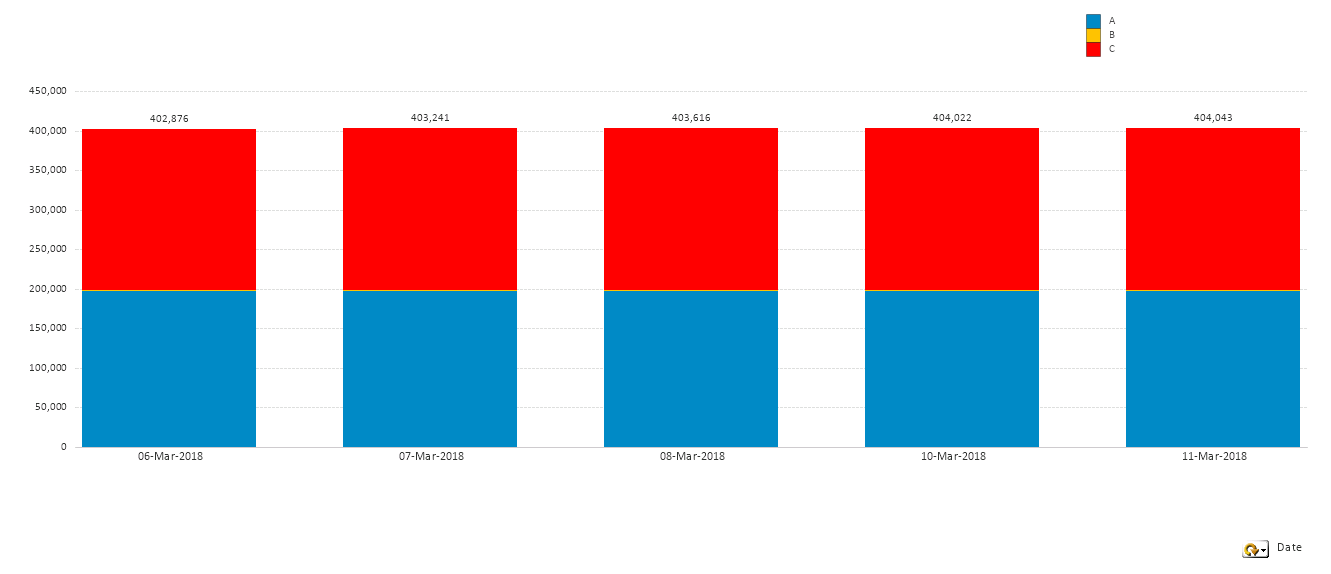
I have a requirement for a bar chart where I am having 3 expressions A,B,C which is a stacked bar graph. When i click on Blue colour legend i.e A the blue bars only should show up , and for other two expressions also the same must be achieved.
I am not sure like how we can achieve this for the expressions. I tried with valuelist but it doesnt work. Any inputs to achieve this would be helpful

- Mark as New
- Bookmark
- Subscribe
- Mute
- Subscribe to RSS Feed
- Permalink
- Report Inappropriate Content
Hello R Harish
Unfortunately this is not possible.
In the stacked bar chart you can only select dimension values, not the expressions.
You can drill down to the single bar and then to the bar segment, but you can not drill down to an expression.
Best regards,
Marco
- Mark as New
- Bookmark
- Subscribe
- Mute
- Subscribe to RSS Feed
- Permalink
- Report Inappropriate Content
hello
you can create a button setting a variable to show/hide value
and use that varaible in a conditional expression to show/hide the expression in your graph
- Mark as New
- Bookmark
- Subscribe
- Mute
- Subscribe to RSS Feed
- Permalink
- Report Inappropriate Content
Olivier could you pls let me know how do i write the conditional exp
- Mark as New
- Bookmark
- Subscribe
- Mute
- Subscribe to RSS Feed
- Permalink
- Report Inappropriate Content
for example, you can code 2 buttons each on setting a variable in a toggle mode
if(var1=0,1,0)
in your graph, for each expression, you check conditional and insert the formula var1=0
so your expression will appear only if tou presse the button
(of course, you have to change var1 by something else for the part of your graph)