Unlock a world of possibilities! Login now and discover the exclusive benefits awaiting you.
- Qlik Community
- :
- All Forums
- :
- QlikView App Dev
- :
- Bar chart show columns with 0
- Subscribe to RSS Feed
- Mark Topic as New
- Mark Topic as Read
- Float this Topic for Current User
- Bookmark
- Subscribe
- Mute
- Printer Friendly Page
- Mark as New
- Bookmark
- Subscribe
- Mute
- Subscribe to RSS Feed
- Permalink
- Report Inappropriate Content
Bar chart show columns with 0
Hey Guys,
I encountered the following problem:
I want to make a bar chart of 2 tables. The first table holds Entity names, the second table holds instances for these entities, each with a unique Id.
The bar chart should then show each entity (dimension) with the height of the bar equal to the number of occurences in the second table (expression = count(Id)).
This works fine, but I can not get the two following things to work at the same time:
1. Show entity names with 0 occurences.
2. Hide columns who do not correspond to something selected.
Now I achieved #1 by checking "Show all values" in the dimension tab, but then the chart will always show all bars. I only want to see all bars when nothing is selected, and I want the chart to act 'normal' when any actions are taken.
Does anyone know what I need to do to achieve this?
Kind regards,
Sijmen
- Mark as New
- Bookmark
- Subscribe
- Mute
- Subscribe to RSS Feed
- Permalink
- Report Inappropriate Content
for first
- Mark as New
- Bookmark
- Subscribe
- Mute
- Subscribe to RSS Feed
- Permalink
- Report Inappropriate Content
Thanks for your answer.
I had already checked that option (by default I think). Changing it does not change anything about the chart. Do you know of any other ways to do this?
- Mark as New
- Bookmark
- Subscribe
- Mute
- Subscribe to RSS Feed
- Permalink
- Report Inappropriate Content
Hi,

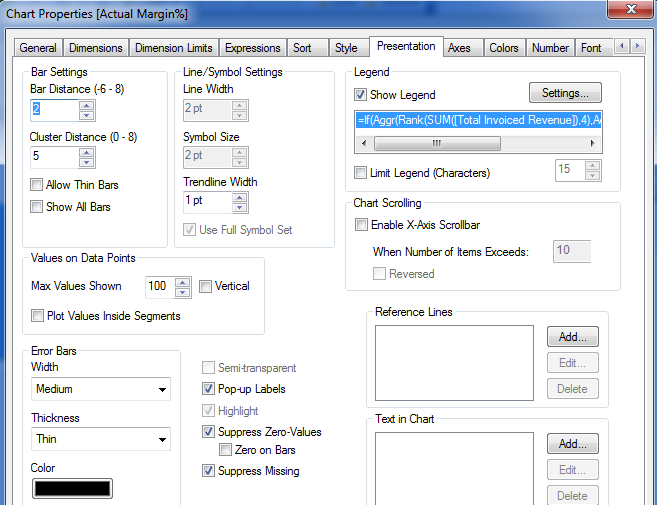
Uncheck suppress zero-values...
- Mark as New
- Bookmark
- Subscribe
- Mute
- Subscribe to RSS Feed
- Permalink
- Report Inappropriate Content
Thanks for your answer!
Could you post the entire function you typed in the legen? It only shows the first part in the screenshot.
- Mark as New
- Bookmark
- Subscribe
- Mute
- Subscribe to RSS Feed
- Permalink
- Report Inappropriate Content
Hi,
you mean this?
=If(Aggr(Rank(SUM([Total Invoiced Revenue]),4),AccountName)<=2,AccountName)
It's just a formula...
Regards
André Gomes
- Mark as New
- Bookmark
- Subscribe
- Mute
- Subscribe to RSS Feed
- Permalink
- Report Inappropriate Content
Yes. I tried the other options shown on your screenshot but to no avail, therefore I figured the formula had something to do with it.
Also, I thought maybe there is a different between a bar which calculates a sum of 0 instead of a count of zero. Since a sum of zero can still hold an instance to show, but a count of zero has nothing to point to.
Could that be the reason it is not working?
Regards,
Sijmen