Unlock a world of possibilities! Login now and discover the exclusive benefits awaiting you.
- Qlik Community
- :
- All Forums
- :
- QlikView App Dev
- :
- Bar chart with grouped bars behind each other
- Subscribe to RSS Feed
- Mark Topic as New
- Mark Topic as Read
- Float this Topic for Current User
- Bookmark
- Subscribe
- Mute
- Printer Friendly Page
- Mark as New
- Bookmark
- Subscribe
- Mute
- Subscribe to RSS Feed
- Permalink
- Report Inappropriate Content
Bar chart with grouped bars behind each other
Hi guys,
I am trying to replicate the chart in my excel attachment with no luck..
Can you please help me..
Best,
Alec
- « Previous Replies
-
- 1
- 2
- Next Replies »
- Mark as New
- Bookmark
- Subscribe
- Mute
- Subscribe to RSS Feed
- Permalink
- Report Inappropriate Content
Bar chart-> Style tab: last 'Look'.
- Mark as New
- Bookmark
- Subscribe
- Mute
- Subscribe to RSS Feed
- Permalink
- Report Inappropriate Content
Hi,
Thank you for the quick reply but that doesn't work. see attached the qvw.
- Mark as New
- Bookmark
- Subscribe
- Mute
- Subscribe to RSS Feed
- Permalink
- Report Inappropriate Content
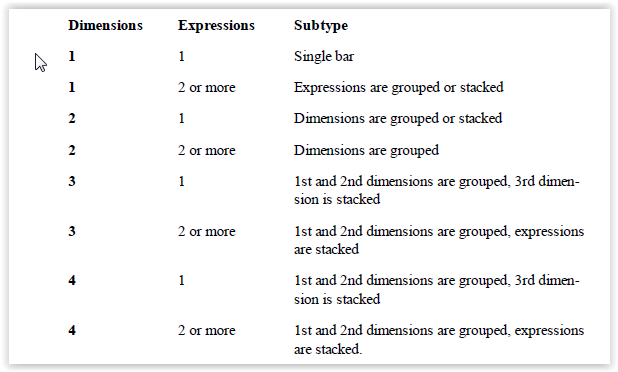
It actually depends on number of dimensions/expressions you use in your chart.
- Mark as New
- Bookmark
- Subscribe
- Mute
- Subscribe to RSS Feed
- Permalink
- Report Inappropriate Content
Thank you again for the information but that doesn't help me..
- Mark as New
- Bookmark
- Subscribe
- Mute
- Subscribe to RSS Feed
- Permalink
- Report Inappropriate Content
I am still not able to find a solution to replicate the chart I have attached on my post..and would appreciate any help or suggestion.
- Mark as New
- Bookmark
- Subscribe
- Mute
- Subscribe to RSS Feed
- Permalink
- Report Inappropriate Content
Hi,
I think this chart is not possible in Qlikview, the best chart for this is the Line chart you can see the flow of the values clearly.
Regards,
Jagan.
- Mark as New
- Bookmark
- Subscribe
- Mute
- Subscribe to RSS Feed
- Permalink
- Report Inappropriate Content
Hi Alec
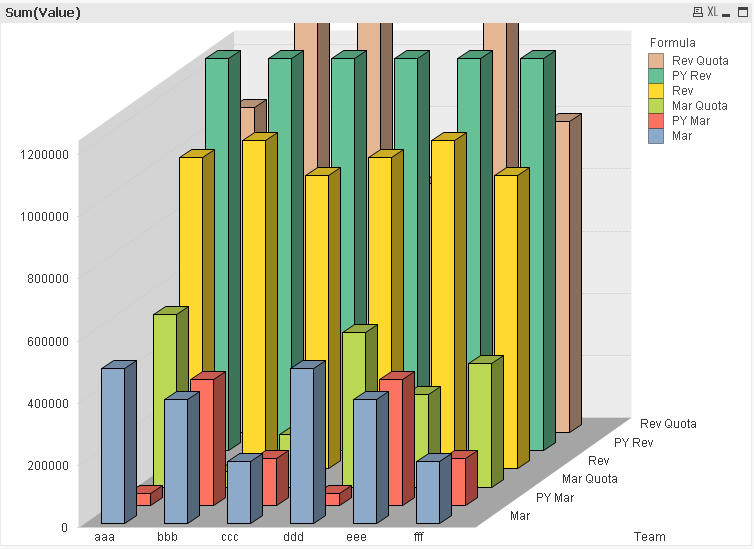
you need to restructure your data.
Please see screenshot & check attached qvw-file.

Let me know when you have questions.
Best regards,
Ronny
PS: Maybe you can use File Wizard (Transform) to restructure the data.
- Mark as New
- Bookmark
- Subscribe
- Mute
- Subscribe to RSS Feed
- Permalink
- Report Inappropriate Content
Hi,
Thank you for your help.. this works if I can modify my data but I cannot, the expressions to calculate PY Mar, PY Rev and PY Quota have set analysis in them and I am afraid I will not be able to change the structure..
Any thoughts?
best,
Alec
- Mark as New
- Bookmark
- Subscribe
- Mute
- Subscribe to RSS Feed
- Permalink
- Report Inappropriate Content
Hi Alec,
Please check attached file for solution. Hope it helps you.
Regards,
jagan.
- « Previous Replies
-
- 1
- 2
- Next Replies »