Unlock a world of possibilities! Login now and discover the exclusive benefits awaiting you.
- Qlik Community
- :
- All Forums
- :
- QlikView App Dev
- :
- Bar chart with overlaped bar
- Subscribe to RSS Feed
- Mark Topic as New
- Mark Topic as Read
- Float this Topic for Current User
- Bookmark
- Subscribe
- Mute
- Printer Friendly Page
- Mark as New
- Bookmark
- Subscribe
- Mute
- Subscribe to RSS Feed
- Permalink
- Report Inappropriate Content
Bar chart with overlaped bar
Hello,
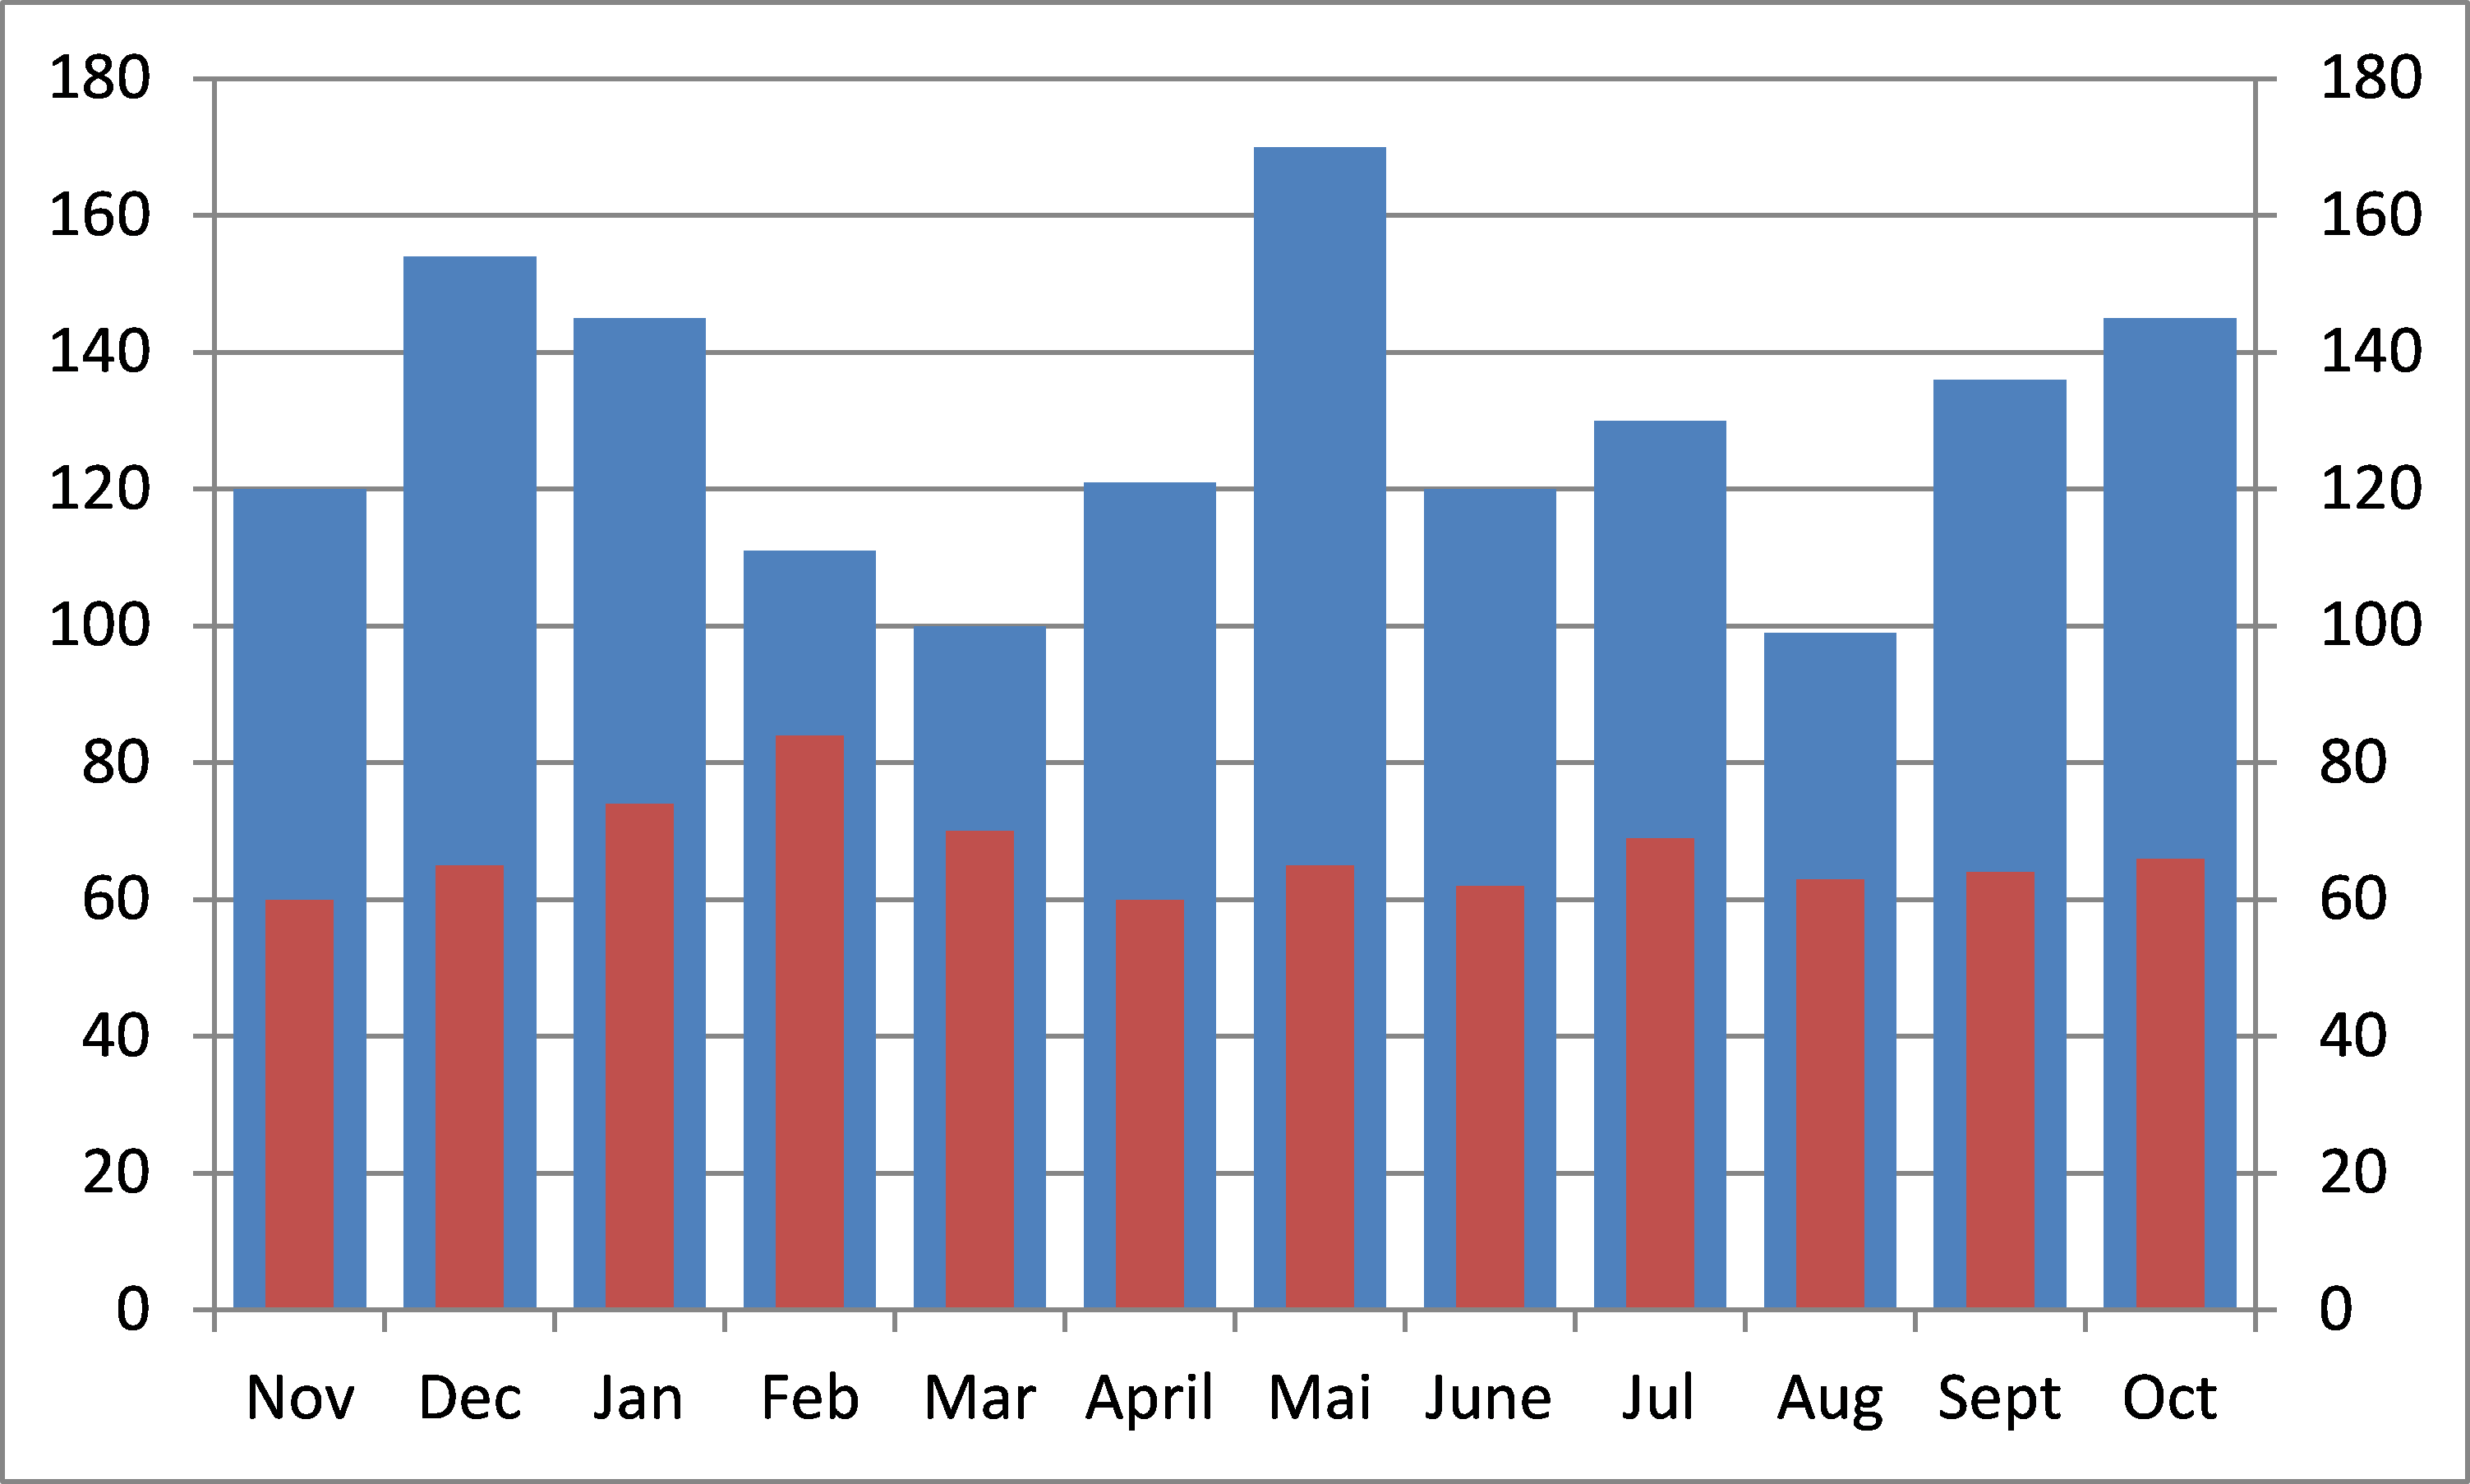
Do you know if it's possible to do this kind of graph ? (with for each month, 2 différents expressions at the same place but with different bar witdh)

Many thanks in advance
- « Previous Replies
- Next Replies »
Accepted Solutions
- Mark as New
- Bookmark
- Subscribe
- Mute
- Subscribe to RSS Feed
- Permalink
- Report Inappropriate Content
Hi,
one solution to turn this chart
into this one
could be:
hope this helps
regards
Marco
- Mark as New
- Bookmark
- Subscribe
- Mute
- Subscribe to RSS Feed
- Permalink
- Report Inappropriate Content
Could be done by overlaying 2 charts.
- Mark as New
- Bookmark
- Subscribe
- Mute
- Subscribe to RSS Feed
- Permalink
- Report Inappropriate Content
- Mark as New
- Bookmark
- Subscribe
- Mute
- Subscribe to RSS Feed
- Permalink
- Report Inappropriate Content
Hello,
I already tried it but I can't change the bar width for the second graph.
- Mark as New
- Bookmark
- Subscribe
- Mute
- Subscribe to RSS Feed
- Permalink
- Report Inappropriate Content
Hi,
one solution to turn this chart
into this one
could be:
hope this helps
regards
Marco
- Mark as New
- Bookmark
- Subscribe
- Mute
- Subscribe to RSS Feed
- Permalink
- Report Inappropriate Content
Wow!!!!, how is this thing even working? I don't understand what you have done ![]() . I feel dumb asking, but can you explain the settings a little more (although you have already showed all of them in the image above)
. I feel dumb asking, but can you explain the settings a little more (although you have already showed all of them in the image above)
- Mark as New
- Bookmark
- Subscribe
- Mute
- Subscribe to RSS Feed
- Permalink
- Report Inappropriate Content
Hi Sunny,
I'm glad you like it.
It just struck me that one could make a group of bars appear as one single bar when reducing the space in between to zero.
So I used a second calculated ValueLoop dimension to create clusters of three stacked bars each.
The side bars (1 and 3) here only get a value for the second expression, while the middle bar has values for both the first and second expression. The second expression then is reduced by the first expression value to let the middle stack height equal the side bar height in cases where the first expression is less than the second one.
I'm not convinced this explains it well enough ...?
Marco
- Mark as New
- Bookmark
- Subscribe
- Mute
- Subscribe to RSS Feed
- Permalink
- Report Inappropriate Content
That's brillant!
- Mark as New
- Bookmark
- Subscribe
- Mute
- Subscribe to RSS Feed
- Permalink
- Report Inappropriate Content
thanks
- Mark as New
- Bookmark
- Subscribe
- Mute
- Subscribe to RSS Feed
- Permalink
- Report Inappropriate Content
It does and it is amazing what you did marcowedel. You are amazing
- « Previous Replies
- Next Replies »