Unlock a world of possibilities! Login now and discover the exclusive benefits awaiting you.
- Qlik Community
- :
- All Forums
- :
- QlikView App Dev
- :
- Bar chart
- Subscribe to RSS Feed
- Mark Topic as New
- Mark Topic as Read
- Float this Topic for Current User
- Bookmark
- Subscribe
- Mute
- Printer Friendly Page
- Mark as New
- Bookmark
- Subscribe
- Mute
- Subscribe to RSS Feed
- Permalink
- Report Inappropriate Content
Bar chart
Hi All,
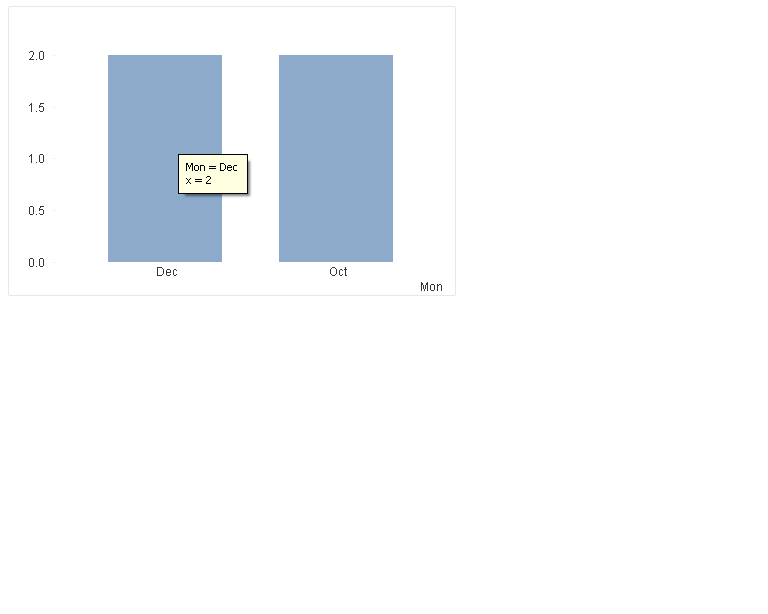
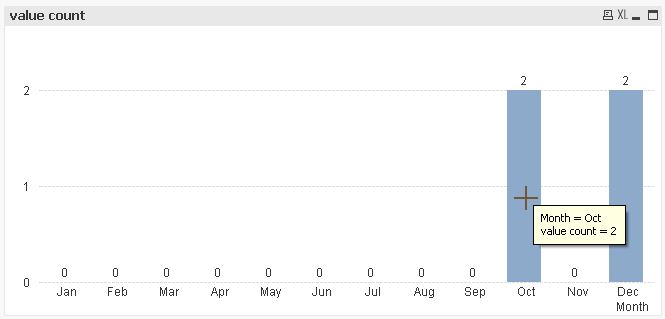
I am having following data.Based on the data I developed one bar chart ,But it shows Dec,Oct data .But not showing Nov data.But i want to display Nov count as 0.
Here
1.Dimension is Month.
2.Expression is Count(Value)
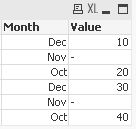
Month,Value
Dec,10
Nov,
Oct,20
Dec,30
Nov,
Oct,40
- Mark as New
- Bookmark
- Subscribe
- Mute
- Subscribe to RSS Feed
- Permalink
- Report Inappropriate Content
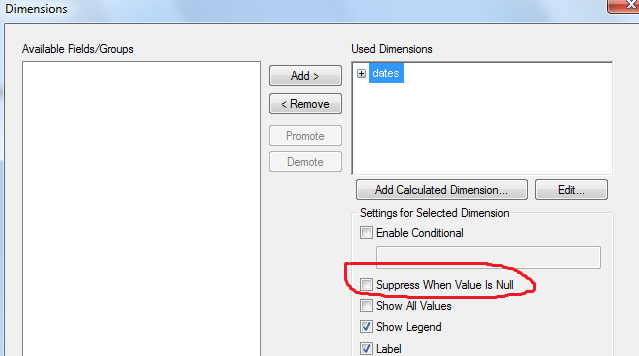
uncheck 'Suppress Zero Values' under presetation tab of chart properties. find the attachment.
- Mark as New
- Bookmark
- Subscribe
- Mute
- Subscribe to RSS Feed
- Permalink
- Report Inappropriate Content
Unchecked the bellow options in Presentation tab and try
1) Suppress Zero Values
2) Suppress Missing
- Mark as New
- Bookmark
- Subscribe
- Mute
- Subscribe to RSS Feed
- Permalink
- Report Inappropriate Content
Properties > Presentation
1. Uncheck Supree Zero Values
2. Tick Zero on Values
Properties > Expression
1. Tick value on Data Points.
- Mark as New
- Bookmark
- Subscribe
- Mute
- Subscribe to RSS Feed
- Permalink
- Report Inappropriate Content
Hi,
one solution to show even months without values could be:
tabData:
LOAD RecNo() as ID,
    Month(Date#(Month,'MMM')) as Month,
    If(Len(Value),Value) as Value
INLINE [
    Month, Value
    Dec, 10
    Nov
    Oct, 20
    Dec, 30
    Nov
    Oct, 40
];

tabMonths:
LOAD Month(Date#(RecNo(),'M')) as Month
AutoGenerate 12;
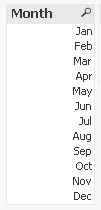
Loading the months like this avoids sorting issues like in your screenshot.
hope this helps
regards
Marco
- Mark as New
- Bookmark
- Subscribe
- Mute
- Subscribe to RSS Feed
- Permalink
- Report Inappropriate Content
Hi ,
you can try this.