Unlock a world of possibilities! Login now and discover the exclusive benefits awaiting you.
- Qlik Community
- :
- All Forums
- :
- QlikView App Dev
- :
- Re: Bar will come after Quarter completed
- Subscribe to RSS Feed
- Mark Topic as New
- Mark Topic as Read
- Float this Topic for Current User
- Bookmark
- Subscribe
- Mute
- Printer Friendly Page
- Mark as New
- Bookmark
- Subscribe
- Mute
- Subscribe to RSS Feed
- Permalink
- Report Inappropriate Content
Bar will come after Quarter completed
Dear All,
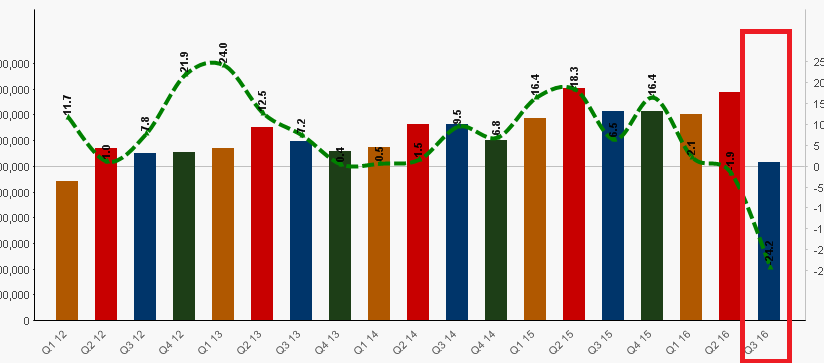
I have one chart with one dimension in that all data is showing perfectly but my requirement in below chart I want to display Q3 bar after it completed means after 31-Dec-15 .
I don't want to display bar for Q3.
PFA..
Thanks
- « Previous Replies
-
- 1
- 2
- Next Replies »
Accepted Solutions
- Mark as New
- Bookmark
- Subscribe
- Mute
- Subscribe to RSS Feed
- Permalink
- Report Inappropriate Content
There could be many solutions. One is using calculated dimension like:
Aggr(If(Count(Distinct Date)=3,QuarterYear),QuarterYear)
PFA
- Mark as New
- Bookmark
- Subscribe
- Mute
- Subscribe to RSS Feed
- Permalink
- Report Inappropriate Content
Not very clear!
Could you post a sample screenshot how the output should look like?
- Mark as New
- Bookmark
- Subscribe
- Mute
- Subscribe to RSS Feed
- Permalink
- Report Inappropriate Content
Hi Tresesco,
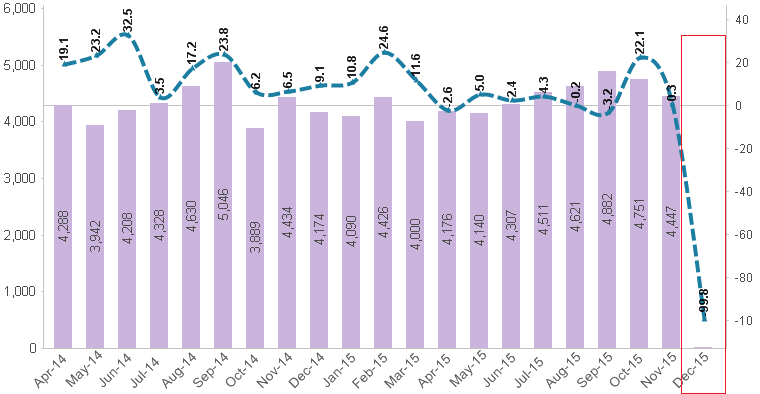
I don't want bar for Q3 for time being because Q3 is not completed yet. It should display but after 31th December month sales happens.
So I want completed Quarter ...
Q4 Should display on 1st April 2016
PFA I don't want highlighted bar
- Mark as New
- Bookmark
- Subscribe
- Mute
- Subscribe to RSS Feed
- Permalink
- Report Inappropriate Content
you can try something like
1. Create a master calendar
2. add a quarter_end_flag in the master calendar, with the help of it do a resident load of qurater that have a quarter_end_flag
3. use this field in as chart dimension.
-Sundar
- Mark as New
- Bookmark
- Subscribe
- Mute
- Subscribe to RSS Feed
- Permalink
- Report Inappropriate Content
Hi PFA,
Try to use a flag to control the display of your dimension and expression. Please see attached the flag that I have added to your graph properties tabs:
- Dimension
- Expressions
- Sort
Kind Regards,
Arohan
- Mark as New
- Bookmark
- Subscribe
- Mute
- Subscribe to RSS Feed
- Permalink
- Report Inappropriate Content
There could be many solutions. One is using calculated dimension like:
Aggr(If(Count(Distinct Date)=3,QuarterYear),QuarterYear)
PFA
- Mark as New
- Bookmark
- Subscribe
- Mute
- Subscribe to RSS Feed
- Permalink
- Report Inappropriate Content
Put below calculated dimension & check Suppress when value is null
=aggr(if( monthname(max(Date))=monthname(QuarterEnd(max(Date))),QuarterYear),QuarterYear)
- Mark as New
- Bookmark
- Subscribe
- Mute
- Subscribe to RSS Feed
- Permalink
- Report Inappropriate Content
Hi All,
Can anyone tell me same for Months I want bar for completed months.
Dim: MonthYear
PFA I don't want highlighted bar
- Mark as New
- Bookmark
- Subscribe
- Mute
- Subscribe to RSS Feed
- Permalink
- Report Inappropriate Content
I'd use this as a formula for the dimension and expression
if(MonthEnd<Today(),MonthYear)
- Mark as New
- Bookmark
- Subscribe
- Mute
- Subscribe to RSS Feed
- Permalink
- Report Inappropriate Content
try this
=aggr(if( monthname(max(Date))=monthname(MonthEnd(max(Date))),MonthYear),MonthYear)
- « Previous Replies
-
- 1
- 2
- Next Replies »