Unlock a world of possibilities! Login now and discover the exclusive benefits awaiting you.
- Qlik Community
- :
- All Forums
- :
- QlikView App Dev
- :
- Re: Before() Function in Pivot Table
- Subscribe to RSS Feed
- Mark Topic as New
- Mark Topic as Read
- Float this Topic for Current User
- Bookmark
- Subscribe
- Mute
- Printer Friendly Page
- Mark as New
- Bookmark
- Subscribe
- Mute
- Subscribe to RSS Feed
- Permalink
- Report Inappropriate Content
Before() Function in Pivot Table
Hello community,
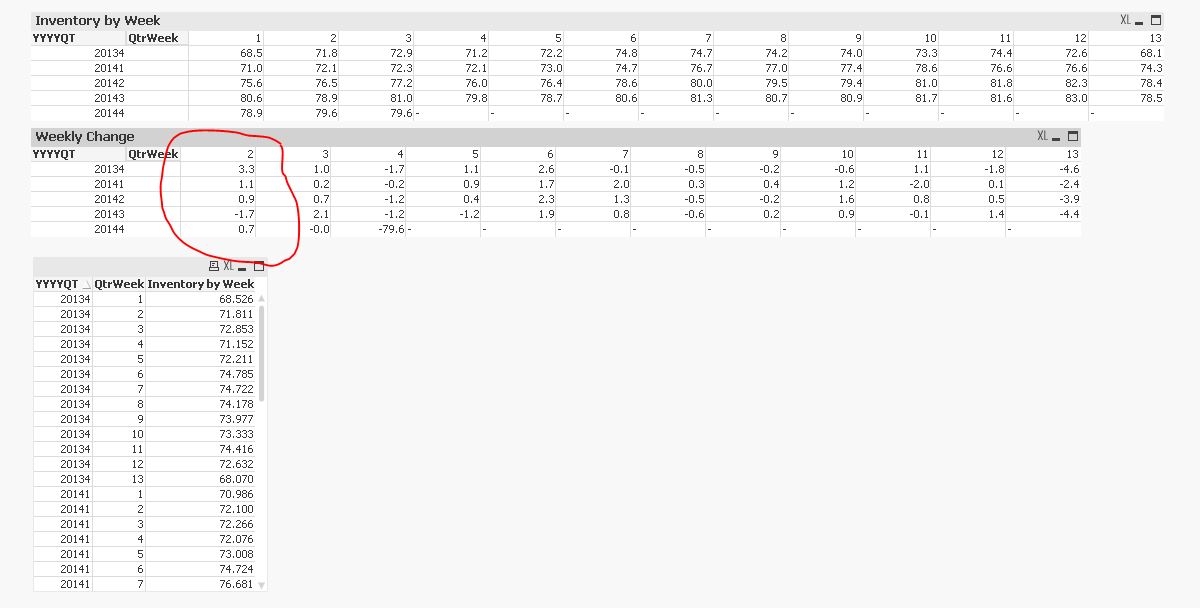
I have a requirement to create a pivot table to show the Inventory Weekly change.
I'm using the Before () function, however I can't get the chart to display the weekly change for the first week of each quarter. I'm attaching a sample QVW file.
Thanks for your help!
Accepted Solutions
- Mark as New
- Bookmark
- Subscribe
- Mute
- Subscribe to RSS Feed
- Permalink
- Report Inappropriate Content
If you have data prior to 20134, then I would believe it should work automatically with this:
Aggr(RangeSum(Sum([Inventory by Week]),-Above(TOTAL SUM([Inventory by Week]))), (YYYYQT, (NUMERIC)), (QtrWeek,(NUMERIC)))
Is it not working? I mean it is working for 20141 right? it is doing 20141 week 1 - 20134 week 13?, so I think it should do the same for 20131 week 1 also.
- Mark as New
- Bookmark
- Subscribe
- Mute
- Subscribe to RSS Feed
- Permalink
- Report Inappropriate Content
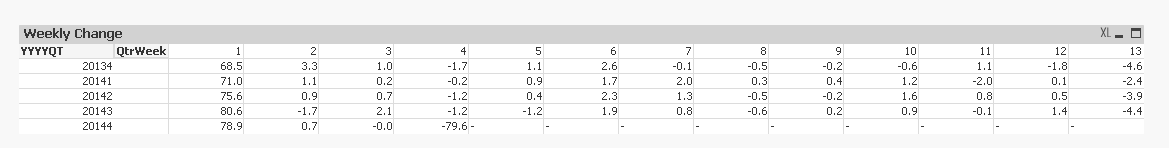
What numbers do you expect to see Carlos? This?
I don't think that you want this, but if you do, I used RangeSum to do this
RangeSum((SUM([Inventory by Week])),
-(Before(SUM([Inventory by Week]))))
- Mark as New
- Bookmark
- Subscribe
- Mute
- Subscribe to RSS Feed
- Permalink
- Report Inappropriate Content
or this?
Aggr(RangeSum(Sum([Inventory by Week]),-Above(TOTAL SUM([Inventory by Week]))), (YYYYQT, (NUMERIC)), (QtrWeek,(NUMERIC)))
- Mark as New
- Bookmark
- Subscribe
- Mute
- Subscribe to RSS Feed
- Permalink
- Report Inappropriate Content
As always thank you Sunny for your great suggestions!
Using the Aggr, Range Sum, Total (second solution you suggested) gets me very close to the results I am looking for. On my data set I have YYYYQT dated earlier than YYYYQT= 20134. So, for the first cell (QtrWeek= 1, YYYYQT = 20134 in the sample) I am expecting to see the the beginning inventory in first week of 20134 minus ending Inventory in last week 20133 (week 13). If for example, Inventory for 20133 week 13 was 65.5, I expect to see 3.0 on that first cell.
All the results for the remaining weeks are accurate.
Is it possible to achieve that with set analysis?
- Mark as New
- Bookmark
- Subscribe
- Mute
- Subscribe to RSS Feed
- Permalink
- Report Inappropriate Content
If you have data prior to 20134, then I would believe it should work automatically with this:
Aggr(RangeSum(Sum([Inventory by Week]),-Above(TOTAL SUM([Inventory by Week]))), (YYYYQT, (NUMERIC)), (QtrWeek,(NUMERIC)))
Is it not working? I mean it is working for 20141 right? it is doing 20141 week 1 - 20134 week 13?, so I think it should do the same for 20131 week 1 also.
- Mark as New
- Bookmark
- Subscribe
- Mute
- Subscribe to RSS Feed
- Permalink
- Report Inappropriate Content
Thanks Sunny, it works for all the years visible in the chart. I mean if there is data in a previous year not selected in the filter, the first value by default is the total inventory amount at the beginning of the quarter. It doesn't show the change in inventory for the first week visible in the chart, instead it shows the beginning of inventory at that time.
I understand the limitation of the chart and I think that as long as the users understand it as well we will be OK.
One small change I added was defining the NUMERIC value at the beginning of the expression:
Num(Aggr(RangeSum(Sum([Inventory by Week]),-Above(TOTAL SUM([Inventory by Week]))), YYYYQT, QtrWeek)))
Thank you Sunny!
- Mark as New
- Bookmark
- Subscribe
- Mute
- Subscribe to RSS Feed
- Permalink
- Report Inappropriate Content
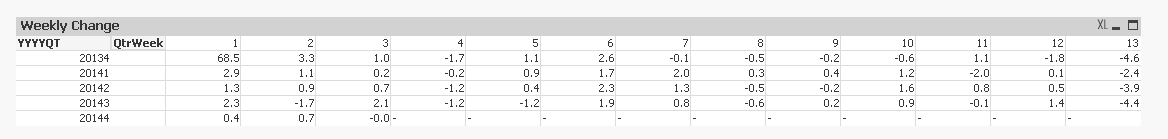
Oh I see what you mean, this should resolve the issue for you
Aggr(RangeSum(Sum([Inventory by Week]),-Above(TOTAL SUM({1}[Inventory by Week]))) * Avg(1), (YYYYQT, (NUMERIC)), (QtrWeek,(NUMERIC)))