Unlock a world of possibilities! Login now and discover the exclusive benefits awaiting you.
- Qlik Community
- :
- All Forums
- :
- QlikView App Dev
- :
- Re: Bell Chart curve
- Subscribe to RSS Feed
- Mark Topic as New
- Mark Topic as Read
- Float this Topic for Current User
- Bookmark
- Subscribe
- Mute
- Printer Friendly Page
- Mark as New
- Bookmark
- Subscribe
- Mute
- Subscribe to RSS Feed
- Permalink
- Report Inappropriate Content
Bell Chart curve
Hello all,
I plotted a bell curve with Dimension as Class(Performance,0.1) and Expression as Count(Performance) and am getting bell curve like below image.
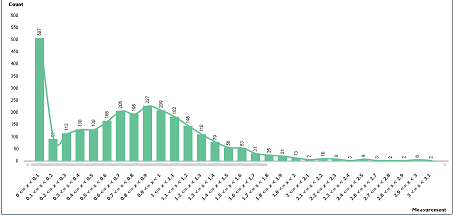
But median and Standard Deviation needs to be taken into account, Please help me in doing this.
Thanks in advance.
- Mark as New
- Bookmark
- Subscribe
- Mute
- Subscribe to RSS Feed
- Permalink
- Report Inappropriate Content
have you explored the normdist function?
- Mark as New
- Bookmark
- Subscribe
- Mute
- Subscribe to RSS Feed
- Permalink
- Report Inappropriate Content
A good example here:
- Mark as New
- Bookmark
- Subscribe
- Mute
- Subscribe to RSS Feed
- Permalink
- Report Inappropriate Content
- Mark as New
- Bookmark
- Subscribe
- Mute
- Subscribe to RSS Feed
- Permalink
- Report Inappropriate Content
Hello Clever,
Thank you for valuable reply.
Can you please copy and paste the code? coz we are using Personnel edition ,not able to open example:(
Thanks In Advance.
- Mark as New
- Bookmark
- Subscribe
- Mute
- Subscribe to RSS Feed
- Permalink
- Report Inappropriate Content
Hello Adam,
Thank you for your valuable reply.
Now i changed dimension as
normdist( CLASS(Performance, 0.1) ,avg({1} total CLASS(Performance, 0.1)),stdev({1} total CLASS(Performance, 0.1)),0 )
Now the chart is looks like below
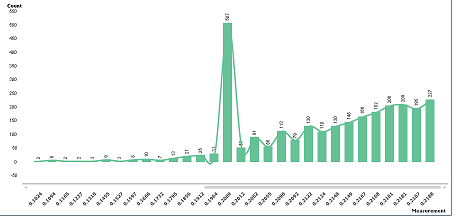
But the requirement is the bell curve should shows which group of sellers are the mean and where other sellers should be at in terms of performance to goal.
Please suggest.
Thanks in advance.